Standard deviation in A/B testing
An A/B test asks whether the difference between two groups is bigger than the noise. The size of the difference is set by your product change. The size of the noise is set by the standard deviation of the metric you chose to measure. That second number is the one that decides how many visitors you need and how many days the test will run, and it is usually the one nobody looks at when the test is planned.
━ SD per visitor, √(p(1 − p))
Noise shrinks with √n, not n
Each group in a test gives you a sample mean: a conversion rate, an average order value, an average session length. How much that mean would wobble if you reran the test is its standard error, the metric's SD divided by the square root of the group size:
SE = σ / √n
A test can only reliably detect a difference that is a few standard errors wide. To halve the smallest difference you can detect, you have to halve the SE, and because of the square root that takes four times as many visitors. Double the metric's SD and you need four times the visitors too. Required sample size grows with the variance, σ², which is why the spread of the metric matters so much. The standard error calculator shows the √n effect on any data you paste in.
The SD of a yes/no metric
Most tests measure conversion: each visitor either does the thing (1) or does not (0). The mean of those 0s and 1s is the conversion rate p, and the standard deviation of a single visitor's outcome follows directly from the binomial set-up:
σ = √(p (1 − p))
You never have to measure this SD separately; it comes from p. What matters for planning is how big it is relative to p, because tests are usually framed in relative terms ("we want to detect a 10% lift").
| Baseline rate p | SD √(p(1 − p)) | SD ÷ p |
|---|---|---|
| 2% | 0.140 | 7.0 |
| 5% | 0.218 | 4.4 |
| 20% | 0.400 | 2.0 |
| 50% | 0.500 | 1.0 |
The absolute SD is largest at 50%, but the relative SD, the SD divided by the rate, is largest for rare events. A 2% conversion rate is seven times noisier, relative to its own size, than a 50% one. That is the reason tests on low-traffic, low-conversion pages take so long.
A worked sample-size calculation
Suppose a sign-up page converts at 5% and you want to detect a lift to 5.5%, a 10% relative improvement. Use the usual settings: a two-sided significance level of α = 0.05 and 80% power. The numbers here are hypothetical; put your own baseline in their place.
The standard formula for the visitors needed in each group when comparing two proportions is:
n = (z₁₋α/₂ + z₁₋β)² × [p₁(1 − p₁) + p₂(1 − p₂)] / (p₂ − p₁)²
Step by step:
- The z-values: z for α = 0.05 two-sided is 1.960; z for 80% power is 0.842. Their sum squared is (1.960 + 0.842)² = 7.849.
- The variances: p₁(1 − p₁) = 0.05 × 0.95 = 0.0475, and p₂(1 − p₂) = 0.055 × 0.945 = 0.051975. Together, 0.099475.
- The difference to detect: 0.055 − 0.05 = 0.005, squared 0.000025.
- n = 7.849 × 0.099475 ÷ 0.000025 ≈ 31,231 per group (computed with unrounded z-values and rounded up to a whole visitor).
That is 62,462 visitors in total. If the page gets 4,000 visitors a day split evenly, the test needs 62,462 ÷ 4,000 = 15.6 days, so plan for 16, and in practice round up to whole weeks so each weekday is represented equally. The A/B test calculator and the power analysis calculator run the same calculation for other inputs.
Now change only the baseline and the size of the lift:
| Baseline → target | Relative lift | Visitors per group |
|---|---|---|
| 2% → 2.2% | 10% | 80,679 |
| 5% → 5.5% | 10% | 31,231 |
| 20% → 22% | 10% | 6,507 |
| 5% → 6% | 20% | 8,155 |
The first three rows all look for the same 10% relative lift. The low-baseline page needs over twelve times as many visitors as the high-baseline one, and the relative SD column in the earlier table is the reason. The last row shows the other lever: doubling the lift you are trying to detect cuts the sample to about a quarter.
Try it: A/B test calculator
The calculator opens with example counts of 400 and 460 conversions from 5,000 visitors each; enter your own visitors and conversions, and your minimum detectable lift, to get the significance test and a sample-size plan.
For the sample-size plan: the smallest relative lift worth detecting, e.g. 10 for +10%.
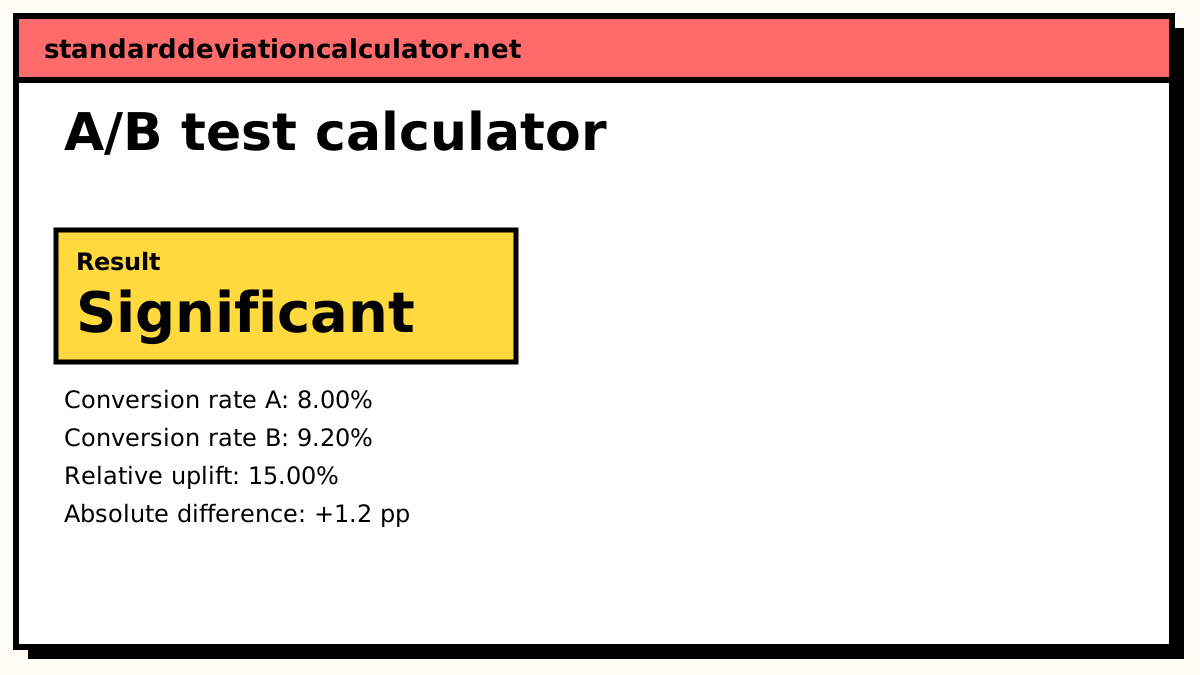
B's conversion rate is higher than A's and the difference is statistically significant at 95% confidence (p = 0.03235).
To detect a 10% relative change from the 8.00% baseline (to 8.80%) with 80% power at α = 0.05, plan for about 18,872 visitors per variant (37,744 in total).
| Variant | Visitors | Conversions | Rate |
|---|---|---|---|
| A (control) | 5,000 | 400 | 8.00% |
| B (variant) | 5,000 | 460 | 9.20% |
Show the working, step by step
Conversion rates.
p̂A = 400 ÷ 5000 = 0.08, p̂B = 460 ÷ 5000 = 0.092
Relative uplift of B over A.
(p̂B − p̂A) ÷ p̂A = 0.012 ÷ 0.08 = 15.00%
Pooled rate, assuming H₀ (no difference) is true.
p̄ = (400 + 460) ÷ (5000 + 5000) = 0.086
Pooled standard error and z.
SE₀ = √(p̄(1 − p̄)(1/nA + 1/nB)) = 0.00560728 z = (p̂B − p̂A) ÷ SE₀ = 0.012 ÷ 0.00560728 = 2.1401
p-value (two-sided).
p = 2 × P(Z > |z|) = 0.03235
95% confidence interval for the difference uses the unpooled SE.
SE = √(p̂A(1 − p̂A)/nA + p̂B(1 − p̂B)/nB) = 0.005606 0.012 ± 1.96 × 0.005606 = [0.00101245, 0.0229876]
Decide the sample size before the test starts and stop there. Checking the p-value every day and stopping when it dips under 0.05 inflates the false-positive rate well above α.
Open the full A/B test calculator for the pooled z-test and the sample-size formula explained.
Continuous metrics: where the SD really bites
For a metric like revenue per visitor there is no formula that gives the SD from the mean; you have to estimate it from past data. It is often huge. Most visitors spend nothing and a few place large orders, so the SD can be several times the mean. For two groups, the sample size per group for a difference δ in means is:
n = 2 (z₁₋α/₂ + z₁₋β)² σ² / δ²
Take an illustrative shop with revenue per visitor averaging $3 and an SD of $15. Detecting a 10% lift ($0.30) needs 2 × 7.849 × 225 ÷ 0.09 ≈ 39,245 visitors per group. If a handful of very large orders pushes the SD to $30, the requirement quadruples to about 157,000. The mean did not change at all; only the spread did.
That is why experienced teams spend effort on reducing the metric's variance before they spend it on waiting longer. Capping extreme values at a high percentile, using a pre-experiment measure of each user as a covariate, or switching to a less noisy metric that tracks the same goal can each shorten a test more than any amount of patience. The sample size calculator is useful for the survey-style version of the same question, where you need a given margin of error on a single rate.
A checklist before you launch
Know the baseline rate or, for a continuous metric, an SD from recent data. Decide the smallest lift worth detecting before you see any results. Compute the sample size and convert it into days using real traffic. If the answer is months, either choose a larger lift, a less variable metric, or accept that this page cannot be tested reliably at its current traffic. Each of those decisions comes down to the same ratio: the effect you want to see, against the standard deviation you are measuring it through.
Related calculators
-
A/B test calculator
Significance, uplift and sample size for two conversion rates.
-
Power analysis calculator
Sample size for a chosen effect size, α and power, with a power curve.
-
Standard error calculator
SD ÷ √n, the quantity every A/B test is really about.
Common questions
What is the standard deviation of a conversion rate?
For a single visitor who either converts (1) or does not (0), the standard deviation is √(p(1 − p)), where p is the conversion rate. At 5% that is 0.218. The standard error of the observed rate across n visitors is that figure divided by √n.
Why does my revenue test need so many more visitors than my conversion test?
Revenue per visitor is mostly zeros with a few large orders, so its standard deviation is often several times its mean. Required sample size scales with the variance, the SD squared, so a metric with five times the relative spread needs about 25 times the visitors to detect the same relative lift.
Can I stop a test early if it already looks significant?
Not if the test was designed for a fixed sample size. Checking repeatedly and stopping at the first significant result inflates the false-positive rate well above the α you chose. Either run to the planned sample size or use a method built for sequential monitoring.