Mean, median and mode calculator
Enter your numbers to get the mean, median, mode and range together, along with the quartiles and the standard deviation. Ties for the mode are all reported.
Separate numbers with commas, spaces or new lines, or paste a spreadsheet column.
Decimals and negatives are fine; write 10:3 for a value that occurs 3 times.
Your results will appear here: the result first, then the rest of the summary and a chart.
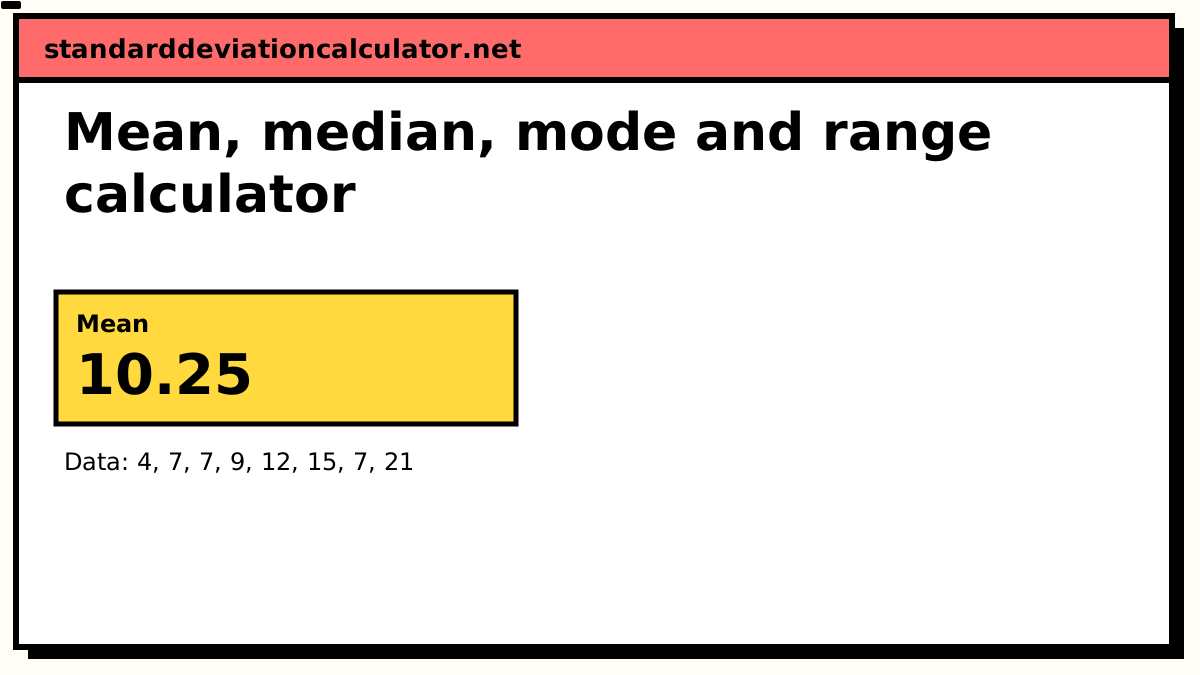
Mean
10.25
Data distribution
Shaded bands mark ±1, ±2 and ±3 SD from the mean. 6 of 8 values (75%) fall within ±1 SD.
Chart as text
Mean 10.25, sample standard deviation s = 5.52268, from 8 values between 4 and 21.
- Within ±1 SD (4.727 to 15.77): 6 of 8 values (75%). About 68% for normal data.
- Within ±2 SD: 8 (100%). About 95% for normal data.
- Within ±3 SD: 8 (100%). About 99.7% for normal data.
Show the working, step by step
The three averages
| Mean | Median | Mode | |
|---|---|---|---|
| How | Sum ÷ count | Middle of the sorted list | Most frequent value |
| Uses every value | Yes | No, only the middle | No |
| Affected by outliers | Strongly | Barely | Not at all |
| Works on categories | No | Only if ordered | Yes |
| Always exists | Yes | Yes | No |
| Always unique | Yes | Yes | No |
Why the choice changes the answer
Take nine salaries at a small company, in thousands:
38, 41, 42, 44, 45, 47, 49, 52, 480.
- Mean: 838 ÷ 9 = 93.1, higher than eight of the nine people earn.
- Median: 45, the fifth value, and a fair description of a typical salary here.
- Mode: none, as every value occurs once.
Both the mean and the median are correct arithmetic. Only one of them describes what a new hire should expect. That single 480, a founder's package, is enough to make the mean misleading, and it is precisely why income statistics are reported as medians.
The relationship to skew
How the three averages line up is itself a diagnostic of the distribution's shape:
- Mean ≈ median ≈ mode: roughly symmetric.
- Mean > median > mode: right-skewed, with a long tail of high values. Incomes, house prices, waiting times.
- Mean < median < mode: left-skewed, with a tail of low values. Exam scores on an easy test, age at death in a developed country.
Comparing the mean and median that the calculator reports is a quick way to check for skew before deciding which summary to publish, and before assuming that z-score percentiles or the 68–95–99.7 rule will behave.
Median, quartiles and the IQR
The median splits the data in half. The quartiles split it into quarters: Q1 is the median of the lower half, Q3 the median of the upper. The interquartile range, Q3 − Q1, spans the middle 50% of the data and is a robust alternative to the standard deviation when outliers are present.
There are several defensible conventions for calculating quartiles, and different software
gives slightly different answers on small datasets. This calculator uses linear interpolation
between order statistics, the same definition as R's default type 7 and Excel's
PERCENTILE.INC, so results will match those.
The methodology page has the detail.
Related calculators
-
Standard deviation calculator
Spread around the mean, in the data’s own units.
-
Variance calculator
Squared spread, for further calculation.
-
Grouped data
When your data arrives as a frequency table.
-
Descriptive statistics
All the averages and spreads at once, plus skewness and kurtosis.
Common questions
What is the difference between mean, median and mode?
The mean is the arithmetic average: add everything and divide by the count. The median is the middle value once the data is sorted. The mode is the value that occurs most often.
All three are "averages" in ordinary speech, and on symmetric data they land close together. On skewed data they separate, sometimes dramatically, and the choice between them changes the story the number tells.
Can a dataset have more than one mode?
Yes. Two values tied for most frequent make the data bimodal; more than two, multimodal. If every value occurs exactly once there is no mode at all. This calculator reports every tied value.
When should I use the median instead of the mean?
When the data is skewed or contains outliers. The mean is pulled towards extreme values; the median is not. This is why incomes, house prices and response times are reported as medians; a handful of very large values would otherwise drag the mean somewhere no typical case sits.
How is the median found with an even number of values?
Average the two middle values. For 3, 7, 8, 12 the middle pair is 7 and 8,
so the median is 7.5. Note the median then need not be a value that actually appears in
the data.
What is the range?
The largest value minus the smallest. It is the simplest measure of spread and the most fragile: a single outlier sets it entirely. The standard deviation or the interquartile range are far more stable.