Statistics
Descriptive statistics calculator
Descriptive statistics summarise a dataset's centre, spread and shape. Paste your numbers to get all of them in one table — including skewness and kurtosis — with the working shown.
Separate numbers with commas, spaces or new lines, or paste a spreadsheet column.
Decimals and negatives are fine; write 10:3 for a value that occurs 3 times.
Your results will appear here: the result first, then the rest of the summary and a chart.
Descriptive statistics
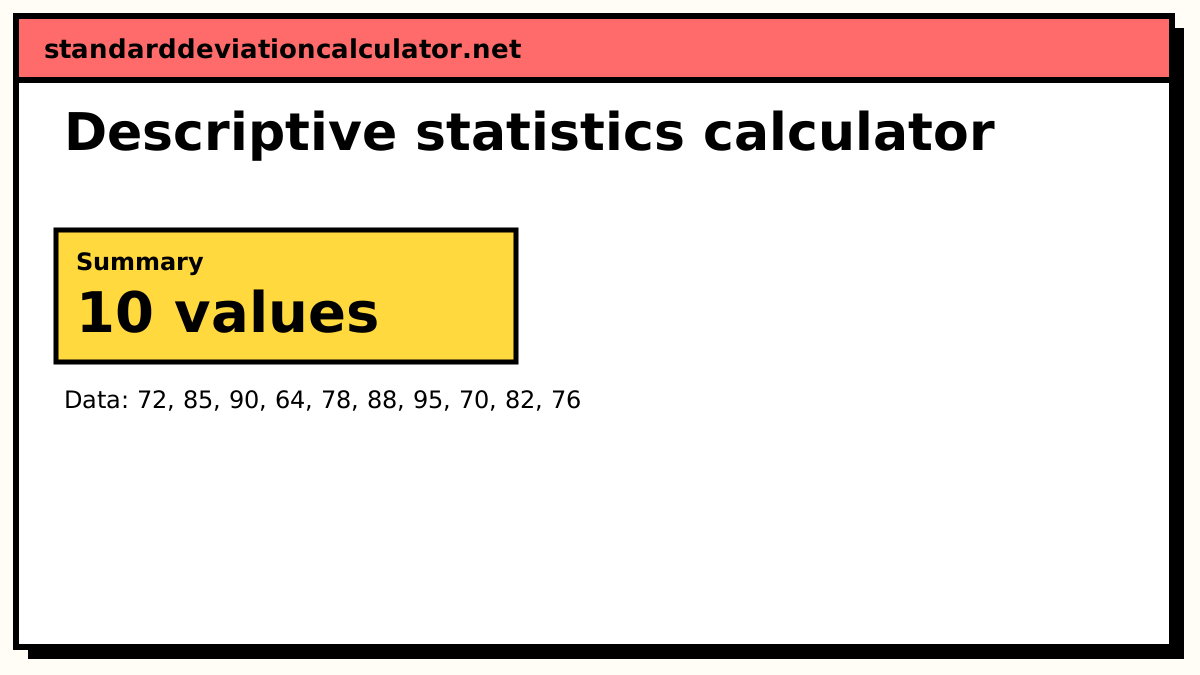
10 values
The shape behind the skewness and kurtosis: 10 values in 5 bins, with the normal curve of the same mean and standard deviation for comparison.
Show the working, step by step
What each statistic tells you
| Group | Statistics | Question it answers |
|---|---|---|
| Centre | Mean, median, mode | What is a typical value? |
| Spread | Standard deviation, variance, range, IQR, coefficient of variation | How far apart are the values? |
| Position | Minimum, Q1, Q3, maximum | Where do the quarters of the data fall? |
| Shape | Skewness, excess kurtosis | Is it lopsided? Are the tails heavier than a normal curve's? |
| Precision | Standard error, 95% confidence interval | How well does this sample pin down the population mean? |
The mean and standard deviation are the pair most reports quote. When the mean and median differ noticeably, or skewness is large, the median and IQR describe the data more honestly, because a few extreme values pull the mean and standard deviation towards them.
Reading skewness and kurtosis
Skewness measures lopsidedness. It is positive when a long tail stretches to the right (a few unusually high values, as with incomes), negative when the tail stretches left, and near zero for a symmetric shape. A common rule of thumb treats |skewness| below 0.5 as roughly symmetric, 0.5 to 1 as moderate and above 1 as strong.
Excess kurtosis compares the tails with a normal distribution's. Zero means normal-like tails; positive means more of the variation comes from occasional extreme values; negative means the data is flatter, with fewer extremes. It says little about how "peaked" a distribution looks, despite the common description.
Both are unstable in small samples. Below about 30 values, a single observation can swing them a long way, so read them alongside the histogram rather than on their own.
The formulas
With n values, mean x̄ and sample standard deviation s:
Skewness G1 = n ÷ ((n − 1)(n − 2)) × Σ((x − x̄) ÷ s)³ Excess kurtosis G2 = n(n + 1) ÷ ((n − 1)(n − 2)(n − 3)) × Σ((x − x̄) ÷ s)⁴ − 3(n − 1)² ÷ ((n − 2)(n − 3)) 95% CI for the mean x̄ ± t* × s ÷ √n, with t* from the t distribution on n − 1 degrees of freedom
These are the bias-adjusted sample versions used by Excel, SPSS and SAS. The standard deviation, variance and quartiles follow the definitions on the methodology page.
Descriptive statistics in Excel
Excel's Analysis ToolPak has a Descriptive Statistics tool (Data → Data Analysis), or use the
functions directly: AVERAGE, MEDIAN, MODE.SNGL,
STDEV.S, VAR.S, QUARTILE.INC, SKEW and
KURT. Every one of them agrees with this calculator. The
Excel guide covers the sample and population
variants.
Related calculators
-
Standard deviation calculator
The spread on its own, with every step of the working.
-
Mean, median, mode & range
The three averages side by side, with every tied mode.
-
Five-number summary
Min, Q1, median, Q3 and max as a box plot.
-
Histogram maker
The shape the skewness and kurtosis describe, drawn out.
-
Outlier & IQR calculator
Which values sit far enough out to check.
-
Confidence interval
An interval for the mean from summary figures alone.
Common questions
What are descriptive statistics?
Numbers that summarise a dataset without drawing conclusions beyond it: where it is centred (mean, median, mode), how spread out it is (standard deviation, variance, range, IQR), and what shape it has (skewness, kurtosis). Inferential statistics — confidence intervals and tests — then use those summaries to say something about a larger population.
What does a skewness of 1 mean?
A clearly right-skewed distribution: most values bunch at the low end with a long tail of high values, as with incomes or waiting times. A common rule of thumb reads |skewness| under 0.5 as roughly symmetric, 0.5 to 1 as moderately skewed and above 1 as strongly skewed. With a small sample, treat any skewness figure as a hint rather than a fact.
Is kurtosis 3 or 0 for a normal distribution?
Both, depending on the convention. The raw fourth-moment kurtosis of a normal
distribution is 3; excess kurtosis subtracts that 3 so a normal distribution
scores 0. This calculator, like Excel's KURT and most software, reports excess
kurtosis.
Why does the calculator show both the sample and population standard deviation?
Because a summary table is often read by someone who did not choose the formula. The sample SD divides by n − 1 and is the right one when the data is a sample from a larger group; the population SD divides by n. How to choose.
Do these results match Excel?
Yes. The mean, MEDIAN, MODE, STDEV.S,
STDEV.P, VAR.S, VAR.P, SKEW and
KURT use the same definitions, and the quartiles match
QUARTILE.INC. The test suite checks skewness and kurtosis against the examples
in Microsoft's own documentation.