Variance calculator
Enter your data to get the variance, along with the standard deviation, the mean and the rest of the summary. The working is shown in full, so you can check it against your own arithmetic.
Separate numbers with commas, spaces or new lines, or paste a spreadsheet column.
Decimals and negatives are fine; write 10:3 for a value that occurs 3 times.
Your results will appear here: the standard deviation first, then the rest of the summary and a chart.
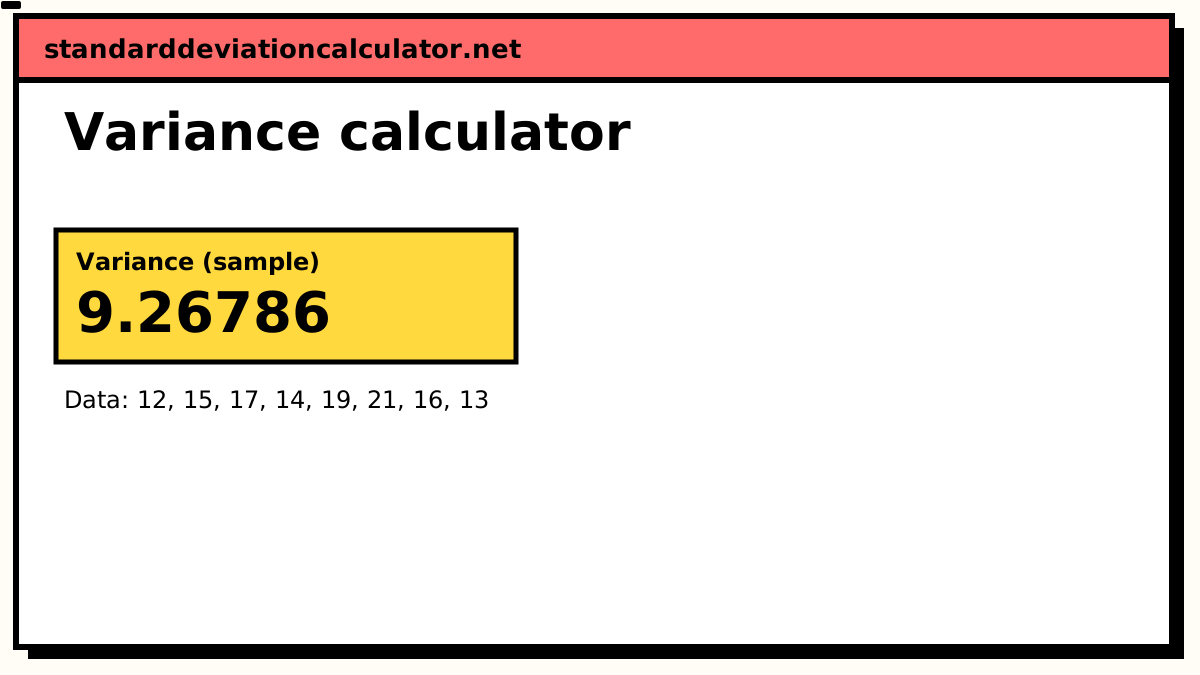
Variance (sample)
9.26786
9.27
The variance is in squared units, so it is hard to read on its own. Its square root is the standard deviation, 3.044: your values typically sit about that far above or below their mean of 15.88.
Population variance (σ²): 8.10938, if these values are the whole group.
- Count (n)
- 8
- Mean (x̄)
- 15.875
- Standard deviation (s)
- 3.04432
- Standard error
- 1.07633
- Minimum
- 12
- Q1 (25%)
- 13.75
- Median
- 15.5
- Q3 (75%)
- 17.5
- Maximum
- 21
- Range
- 9
More statistics (5)
- Relative SD (%RSD)
- 19.1768%
- Coefficient of variation
- 0.191768
- Sum (Σx)
- 127
- Sum of squares, Σ(x − x̄)²
- 64.875
- IQR (Q3 − Q1)
- 3.75
Data distribution
Shaded bands mark ±1, ±2 and ±3 SD from the mean. 5 of 8 values (63%) fall within ±1 SD.
Chart as text
Mean 15.875, sample standard deviation s = 3.04432, from 8 values between 12 and 21.
- Within ±1 SD (12.83 to 18.92): 5 of 8 values (63%). About 68% for normal data.
- Within ±2 SD: 8 (100%). About 95% for normal data.
- Within ±3 SD: 8 (100%). About 99.7% for normal data.
Show the working, step by step
What variance measures
Variance is the average of the squared distances between each value and the mean. It answers the same question as the standard deviation (how spread out is this data?) but stops one step earlier, before the square root that would return the answer to the original units.
Sample: s² = Σ(x − x̄)² / (n − 1) Population: σ² = Σ(x − μ)² / N
Because it is built from squares, variance is always zero or positive, and it grows with the square of the scale of the data: double every value and the variance quadruples, while the standard deviation merely doubles.
Variance or standard deviation: which should you report?
For describing data to a reader, use the standard deviation. Its units match the data, so it can be compared directly against the mean and against individual values.
For doing further mathematics with the spread, use the variance. Its defining advantage is that variances of independent quantities add:
Var(X + Y) = Var(X) + Var(Y) (for independent X and Y)
No such rule holds for standard deviations. This additivity is what makes analysis of variance, portfolio risk decomposition and the whole machinery of linear models work, and it is the reason variance survives despite being harder to interpret.
Variance: a worked example
Data: 4, 8, 6, 5, 3. Sum = 26, n = 5, mean = 5.2.
| x | x − x̄ | (x − x̄)² |
|---|---|---|
| 4 | −1.2 | 1.44 |
| 8 | 2.8 | 7.84 |
| 6 | 0.8 | 0.64 |
| 5 | −0.2 | 0.04 |
| 3 | −2.2 | 4.84 |
| Σ | 0 | 14.8 |
Note that the middle column sums to exactly zero; that always happens, and it is precisely why the deviations must be squared before averaging. Dividing 14.8 by n − 1 = 4 gives a sample variance of 3.7; dividing by N = 5 gives a population variance of 2.96. The corresponding standard deviations are 1.9235 and 1.7205. If your data is always a sample, the sample variance calculator starts in n − 1 mode.
Converting between variance and standard deviation
If somebody has already given you one, you do not need the raw data to get the other: a single operation each way:
s = √(s²) s² = s × s
| Variance | Standard deviation |
|---|---|
| 1 | 1 |
| 4 | 2 |
| 9 | 3 |
| 16 | 4 |
| 25 | 5 |
| 100 | 10 |
| 2 | 1.4142 |
| 3.7 | 1.9235 |
The conversion carries no information about sample versus population; that choice was made when the variance was computed, and square-rooting cannot undo or change it. A sample variance square-roots to a sample standard deviation, and nothing else.
One consequence catches people out: because squaring is not linear, the standard deviation is not proportional to the variance. Doubling a variance multiplies the standard deviation by only √2 ≈ 1.414. So a group with four times the variance of another has twice its standard deviation, not four times. The full comparison is here.
If you need both numbers from raw data rather than one from the other, the variance and standard deviation calculator gives the sample and population versions of each side by side, and the mean, variance and SD table lays out every deviation and square in one table, the way a textbook shows the working.
Variance of a probability distribution
Everything above computes the variance of data you already have. The variance of a random variable (a probability distribution rather than a list of observations) uses a different formula, because each outcome carries a probability instead of counting once:
Var(X) = Σ (x − μ)² P(x) where μ = Σ x P(x)
There is no n and no n − 1 anywhere in it. The probabilities already sum to 1, so they do the averaging themselves, and there is no sample to correct for. A fair six-sided die has μ = 3.5 and Var(X) = 35/12 ≈ 2.9167, giving σ ≈ 1.7078. The standard deviation of a random variable guide works through this and a non-uniform example line by line.
For the standard named distributions the sum has already been done for you:
| Distribution | Variance | Calculator |
|---|---|---|
| Binomial | np(1 − p) | Binomial |
| Poisson | λ | Poisson |
| Normal | σ² | Normal |
| Discrete uniform, 1..n | (n² − 1) / 12 | – |
The Poisson row is worth a second look: its variance equals its mean. Count data whose variance runs well above its mean is overdispersed and is not Poisson, which is the standard diagnostic for that family.
Variance in Excel and Google Sheets
| You want | Excel / Sheets |
|---|---|
| Sample variance | =VAR.S(A1:A20) |
| Population variance | =VAR.P(A1:A20) |
| Sample standard deviation | =STDEV.S(A1:A20) |
| Population standard deviation | =STDEV.P(A1:A20) |
The older VAR() and STDEV() functions still work and are the
sample versions. VARA() and STDEVA() differ in that they
count text as 0 and booleans as 0 or 1, which is rarely what you want.
The full Excel guide is here.
Related calculators
-
Standard deviation calculator
The square root of the variance, in your data’s own units.
-
The formula explained
Each term of the variance and SD formulas, taken apart.
-
Coefficient of variation
Spread relative to the mean, for comparing across scales.
-
Pooled SD
Combining variances across several groups: the reason variance matters.
-
SD vs variance
Which of the two to report, and why both exist.
-
Sum of squares
Σ(x − x̄)², the numerator of the variance on its own.
-
Variance in poker and gambling
Why short runs hide the house edge: expected value vs variance.
-
Variance formula
The formulas behind this calculator, with a step-by-step example.
Common questions
What is the difference between variance and standard deviation?
The standard deviation is the square root of the variance. They contain identical information; they differ only in units. If your data is in kilograms, the variance is in kilograms squared and the standard deviation is in kilograms.
That is why reports quote standard deviations: "the mean weight was 70 kg, SD 4 kg" is readable, whereas "variance 16 kg²" is not.
Why use variance at all if standard deviation is easier to read?
Because variances add and standard deviations do not. For two independent quantities, Var(X + Y) = Var(X) + Var(Y), but the standard deviation of the sum is not the sum of the standard deviations. Every technique that decomposes variation into parts, including ANOVA and portfolio risk models, relies on that additivity.
Can variance be negative?
No. It is an average of squared quantities, so it cannot go below zero. A variance of exactly 0 means every value in the dataset is identical.
If software hands you a small negative variance, it is a floating-point artefact of the "shortcut" computational formula, not a real result. This calculator avoids that failure mode.
Sample or population variance?
Divide by n − 1 for a sample, by N for a population. Use sample unless your numbers are genuinely the whole group you care about. Full comparison here.
How do you calculate the variance of two numbers?
For two numbers a and b, the sample variance is (a − b)² ÷ 2 and the population variance is (a − b)² ÷ 4. For 4 and 10: 36 ÷ 2 = 18 as a sample, 36 ÷ 4 = 9 as a population.
What is xᵢ in the variance formula?
Each individual value in the data, numbered i = 1 to n. The variance formula page explains every symbol with an example.
Frequently asked questions about the variance calculator
Common questions
Is there a free variance calculator?
Use the variance calculator to find the variance of your dataset. The standard deviation is the square root of the variance. Both tools show every step of the working.
Can a variance calculator show the working?
Use the variance calculator to find the variance of your dataset. The standard deviation is the square root of the variance. Both tools show every step of the working.
Can I paste comma-separated values into a variance calculator?
Use the variance calculator to find the variance of your dataset. The standard deviation is the square root of the variance. Both tools show every step of the working.
Can I download the results from a variance calculator?
Use the variance calculator to find the variance of your dataset. The standard deviation is the square root of the variance. Both tools show every step of the working.
How accurate is an online variance calculator?
Use the variance calculator to find the variance of your dataset. The standard deviation is the square root of the variance. Both tools show every step of the working.
What should I do if a variance calculator gives an unexpected result?
Use the variance calculator to find the variance of your dataset. The standard deviation is the square root of the variance. Both tools show every step of the working.
How do I calculate variance with an online variance calculator?
Standard deviation is a measure of how spread out a set of numbers is around their mean. It is the square root of the average squared distance from the mean, expressed in the same units as the original data. A small standard deviation means values cluster close to the mean; a large one means they are widely scattered. See what is standard deviation for a full explanation with examples.
How do I calculate variance and standard deviation in a TI-84 calculator?
Standard deviation is a measure of how spread out a set of numbers is around their mean. It is the square root of the average squared distance from the mean, expressed in the same units as the original data. A small standard deviation means values cluster close to the mean; a large one means they are widely scattered. See what is standard deviation for a full explanation with examples.
Can I calculate variance from a list of numbers?
Use the variance calculator to find the variance of your dataset. The standard deviation is the square root of the variance. Both tools show every step of the working.
Can I calculate variance for negative numbers?
Use the variance calculator to find the variance of your dataset. The standard deviation is the square root of the variance. Both tools show every step of the working.
Can I calculate variance without Excel?
Use the variance calculator to find the variance of your dataset. The standard deviation is the square root of the variance. Both tools show every step of the working.
How do I calculate variance for decimal values?
Use the variance calculator to find the variance of your dataset. The standard deviation is the square root of the variance. Both tools show every step of the working.
Which inputs do I need for variance?
Use the variance calculator to find the variance of your dataset. The standard deviation is the square root of the variance. Both tools show every step of the working.
How do I calculate variance and standard deviation in R?
Standard deviation is a measure of how spread out a set of numbers is around their mean. It is the square root of the average squared distance from the mean, expressed in the same units as the original data. A small standard deviation means values cluster close to the mean; a large one means they are widely scattered. See what is standard deviation for a full explanation with examples.
How do I calculate variance and standard deviation in a Casio scientific calculator?
Standard deviation is a measure of how spread out a set of numbers is around their mean. It is the square root of the average squared distance from the mean, expressed in the same units as the original data. A small standard deviation means values cluster close to the mean; a large one means they are widely scattered. See what is standard deviation for a full explanation with examples.
Can I calculate variance from a frequency table?
Use the variance calculator to find the variance of your dataset. The standard deviation is the square root of the variance. Both tools show every step of the working.
How do I calculate variance online?
Use the variance calculator to find the variance of your dataset. The standard deviation is the square root of the variance. Both tools show every step of the working.
How do I check my variance calculation?
Use the variance calculator to find the variance of your dataset. The standard deviation is the square root of the variance. Both tools show every step of the working.
How can I calculate variance step by step?
Use the variance calculator to find the variance of your dataset. The standard deviation is the square root of the variance. Both tools show every step of the working.
What is the easiest way to calculate variance?
Use the variance calculator to find the variance of your dataset. The standard deviation is the square root of the variance. Both tools show every step of the working.
Can I calculate variance on my phone?
Use the variance calculator to find the variance of your dataset. The standard deviation is the square root of the variance. Both tools show every step of the working.
How do I calculate variance when values repeat?
Use the variance calculator to find the variance of your dataset. The standard deviation is the square root of the variance. Both tools show every step of the working.
How do I calculate variance for a small dataset?
Use the variance calculator to find the variance of your dataset. The standard deviation is the square root of the variance. Both tools show every step of the working.
How do I calculate variance for a large dataset?
Use the variance calculator to find the variance of your dataset. The standard deviation is the square root of the variance. Both tools show every step of the working.