How to calculate standard deviation in Python
Three one-liners, one trap. statistics.stdev() and pandas divide by n − 1;
NumPy divides by n unless you pass ddof=1. Everything below uses the same eight
numbers so you can see exactly where the answers diverge and why.
Standard deviation in Python: the short version
import statistics
statistics.stdev([12, 15, 17, 14, 19, 21, 16, 13])   # 3.0443

import numpy as np
np.std([12, 15, 17, 14, 19, 21, 16, 13], ddof=1)     # 3.0443

import pandas as pd
pd.Series([12, 15, 17, 14, 19, 21, 16, 13]).std()    # 3.0443
All three give the sample standard deviation, which is what you want unless
the values are the complete group you are describing. The one fact to carry away from this
page: NumPy's default is the population formula (ddof=0,
divide by n), while the statistics module and pandas default to the sample
formula (ddof=1, divide by n − 1). Leave off the ddof=1 in the
NumPy line above and you get 2.8477 instead of 3.0443, and a number that will not match
Excel, R or a textbook.
Outputs in the comments are rounded to four decimals. Python itself prints the full float, 3.044315545875155.
The statistics module
Part of the standard library since Python 3.4, so it needs no install. It offers a pair of
functions for each quantity: the plain name is the sample version, the p prefix
is the population version.
import statistics as st

data = [12, 15, 17, 14, 19, 21, 16, 13]

st.mean(data)       # 15.875
st.stdev(data)      # 3.0443  sample: divides by n - 1
st.pstdev(data)     # 2.8477  population: divides by n
st.variance(data)   # 9.2679  sample variance
st.pvariance(data)  # 8.1094  population variance
Two things set this module apart from the array libraries. It computes in exact arithmetic
when you give it Fraction or Decimal values, so it is the right
choice when the answer has to be reproducible to the last digit. And it refuses bad input
loudly: st.stdev([5]) raises StatisticsError: stdev requires at least two
data points rather than returning NaN. It is pure Python, so it is slow on millions of
values, but for the list sizes most scripts handle that never matters.
NumPy
numpy.std takes a ddof argument ("delta degrees of freedom"), which
is subtracted from n in the denominator. The default is 0.
import numpy as np

a = np.array([12, 15, 17, 14, 19, 21, 16, 13])

np.std(a)            # 2.8477  population (ddof=0) -- the default
np.std(a, ddof=1)    # 3.0443  sample
np.var(a, ddof=1)    # 9.2679  sample variance
a.std(ddof=1)        # 3.0443  the method form, same result
The default is not a mistake on NumPy's part; it is the maximum-likelihood estimate, and it
matches the mathematical definition of σ for a population. It is simply the less common
thing to want when the array is a sample. Write ddof=1 every time and the
question never arises.
Rows and columns of a 2-D array
With no axis, NumPy flattens the array and returns one number. axis=0
collapses the rows, giving a value per column; axis=1 collapses the columns,
giving a value per row.
m = np.array([[12, 15, 17, 14],
              [19, 21, 16, 13]])

m.std(ddof=1)                    # 3.0443  all eight values together
m.std(axis=0, ddof=1).round(4)   # [4.9497 4.2426 0.7071 0.7071]  one per column
m.std(axis=1, ddof=1).round(4)   # [2.0817 3.5   ]                one per row
The column figures come from just two values each, which is why they swing so widely. A standard deviation from n = 2 is a legitimate number but a very noisy one.
Missing values
A single NaN anywhere in the array makes np.std return NaN. The
nan-prefixed functions drop them first and use the count that remains.
b = np.array([12, 15, np.nan, 14, 19, 21, 16, 13])

np.std(b, ddof=1)     # nan
np.nanstd(b, ddof=1)  # 3.2514  from the seven values that are left
np.nanvar and np.nanmean exist for the same reason. Note the answer
changed from 3.0443 to 3.2514: dropping the 17, which sat near the mean, made the remaining
data look more spread out. Silently ignoring missing values is convenient but it is still a
decision about the data.
pandas
pandas defaults to ddof=1, the opposite of NumPy, and skips NaN automatically.
Both choices follow R and spreadsheets rather than NumPy, which is usually what data-analysis
code wants.
import pandas as pd

s = pd.Series([12, 15, 17, 14, 19, 21, 16, 13])

s.std()         # 3.0443  sample (ddof=1) -- the default
s.std(ddof=0)   # 2.8477  population
s.var()         # 9.2679  sample variance
On a DataFrame, .std() returns one value per numeric column as a new Series.
axis=1 works across each row instead.
df = pd.DataFrame({'a': [12, 15, 17, 14],
                   'b': [19, 21, 16, 13]})

df.std()
# a    2.081666
# b    3.500000
# dtype: float64

df.std(axis=1)   # one value per row: 4.949747, 4.242641, 0.707107, 0.707107
For a standard deviation per group (per product, per site, per participant), put the data
in long format and use groupby. Chaining .agg() gives the count
and mean alongside, which is worth doing, because a standard deviation without its n is hard
to judge.
df = pd.DataFrame({
    'group': ['x', 'x', 'x', 'x', 'y', 'y', 'y', 'y'],
    'value': [12, 15, 17, 14, 19, 21, 16, 13],
})

df.groupby('group')['value'].std()
# group
# x    2.081666
# y    3.500000
# Name: value, dtype: float64

df.groupby('group')['value'].agg(['count', 'mean', 'std'])
#        count   mean       std
# group
# x          4  14.50  2.081666
# y          4  17.25  3.500000
Missing values are excluded by default and n is reduced to match. Set
skipna=False if you would rather a gap in the data produce NaN and force you to
deal with it.
s = pd.Series([12, 15, None, 14, 19, 21, 16, 13])

s.std()              # 3.2514  NaN dropped, n = 7
s.std(skipna=False)  # nan
s.describe() reports the same std (3.044316 for the full series)
along with the count, mean and quartiles, and is the quickest first look at a new column.
What the libraries are doing
Stripped of the array machinery, the sample standard deviation is five lines. Find the mean, square each value's distance from it, add those up, divide by n − 1, take the square root.
def sample_sd(xs):
    n = len(xs)
    mean = sum(xs) / n
    ss = sum((x - mean) ** 2 for x in xs)
    return (ss / (n - 1)) ** 0.5

sample_sd([12, 15, 17, 14, 19, 21, 16, 13])   # 3.0443
Change n - 1 to n and you have pstdev. The
formula page walks through the same steps by hand.
This two-pass version (mean first, then deviations) is numerically sound. What you should
not write is the one-pass textbook shortcut Σx² − (Σx)²/n: on data with a large
mean and a small spread it subtracts two nearly equal large numbers and can return a negative
variance. Production code uses either two passes, as above, or Welford's running update,
which handles streaming data in a single pass without that cancellation. The
statistics module goes further and sums in exact rational arithmetic. The
methodology page explains why this site's calculators use
Welford's algorithm and shows the failure case.
Weighted and pooled standard deviation
Neither NumPy nor pandas has a weighted standard deviation built in, but
np.average accepts weights and the rest is one line. With
frequency weights, where a weight means "this value occurred w times",
the population form divides by Σw and the sample form by Σw − 1.
import numpy as np

x = np.array([12, 15, 17, 14, 19, 21, 16, 13], dtype=float)
w = np.array([3, 1, 2, 4, 1, 1, 2, 2])          # how often each value occurred

mean_w = np.average(x, weights=w)                # 14.9375
ss_w = (w * (x - mean_w) ** 2).sum()

np.sqrt(ss_w / w.sum())          # 2.5117  population form, divides by Σw = 16
np.sqrt(ss_w / (w.sum() - 1))    # 2.5941  sample form, divides by Σw - 1
You can confirm the frequency interpretation with
np.repeat(x, w).std(ddof=1), which expands the table into sixteen values and
also returns 2.5941. If your weights are reliability weights instead (survey
weights, inverse variances, portfolio shares), the sample denominator becomes
V₁ − V₂/V₁ where V₁ = Σw and V₂ = Σw², which for these weights gives 2.7344. That is the
convention the weighted standard
deviation calculator implements, and it explains the two conventions in more detail.
A pooled standard deviation combines two groups assumed to share a variance. It is the square root of the degrees-of-freedom-weighted mean of the two variances, not the average of the two standard deviations, which is the common error.
import statistics as st

a = [12, 15, 17, 14, 19, 21, 16, 13]
b = [22, 18, 25, 20, 27, 23]

n1, n2 = len(a), len(b)
s1, s2 = st.stdev(a), st.stdev(b)   # 3.0443, 3.2711

sp = (((n1 - 1) * s1**2 + (n2 - 1) * s2**2) / (n1 + n2 - 2)) ** 0.5
sp                                  # 3.1408
That is the denominator of the independent-samples t-test and of Cohen's d. The pooled standard deviation calculator handles more than two groups and shows each term.
Common mistakes
A ddof mismatch. By far the most frequent "Python gives a different answer"
report. np.std returns 2.8477 where Excel's STDEV.S, R's
sd(), a TI-84's Sx and pandas all return 3.0443. Nothing is broken; the
denominators differ. Decide which you mean, then pass ddof explicitly so the
code says so. The gap shrinks as n grows (about 7% at n = 8, under 1% by n = 60), which
is why the bug can hide in a large dataset and surface only when someone checks a small one.
Numbers stored as strings. Data read from a CSV or scraped from a page often
arrives as text. statistics.stdev(['12', '15']) raises
TypeError: can't convert type 'str'; a NumPy array of strings fails inside the
reduction; a pandas string column raises Cannot perform reduction 'std' with string
dtype. All three are telling you the same thing. Convert first:
pd.to_numeric(s, errors='coerce') turns anything unparseable into NaN so you can
see how many rows were affected, or np.array(values, dtype=float) when the data
is clean.
A one-value sample. Dividing by n − 1 = 0 is undefined. The
statistics module raises; NumPy returns NaN with a
RuntimeWarning: Degrees of freedom <= 0; pandas returns NaN silently. The
silent one is the dangerous one: a groupby().std() over groups that happen to
contain a single row will produce NaN for those groups and nothing else, and a later
.mean() will step over them without comment. Check the counts.
Precision. Python integers cannot overflow, so the sum-of-squares step is
safe on plain lists no matter how large the values. Floats are a different matter, and
NumPy's default dtype for a float array is float64, which is fine for almost
everything. The trap is a narrower dtype. Add 10⁹ to each of the eight values and
np.std(..., ddof=1) still returns 3.0443 in float64, but in
float32 it returns 0.0, because representable numbers near 10⁹ are 64 apart and
every value rounds to the same one. If your arrays come from an image library, a GPU
framework or a compact file format, check a.dtype before trusting a spread
that looks too small.
Which library, which default
| Library | Function | Default denominator | To switch |
|---|---|---|---|
| statistics | stdev(data) | n − 1 | Use pstdev(data) for n |
| NumPy | np.std(a) | n | ddof=1 for n − 1 |
| pandas | s.std(), df.std() | n − 1 | ddof=0 for n |
| Excel / Sheets | STDEV.S(range) | n − 1 | STDEV.P for n |
| R | sd(x) | n − 1 | No switch; multiply by √((n − 1)/n) |
NumPy is the odd one out. If a script mixes NumPy with any of the others, the safest habit is
to write ddof=1 on every NumPy call and ddof=0 only where a
population value is deliberately intended, so that a reader can see the choice rather than
having to remember a default.
Check the number your script printed
Paste the same values below and switch between Sample (n − 1) and Population (n). Whichever setting reproduces the number your script printed tells you which denominator it used.
Separate numbers with commas, spaces or new lines, or paste a spreadsheet column.
Decimals and negatives are fine; write 10:3 for a value that occurs 3 times.
Your results will appear here: the standard deviation first, then the rest of the summary and a chart.
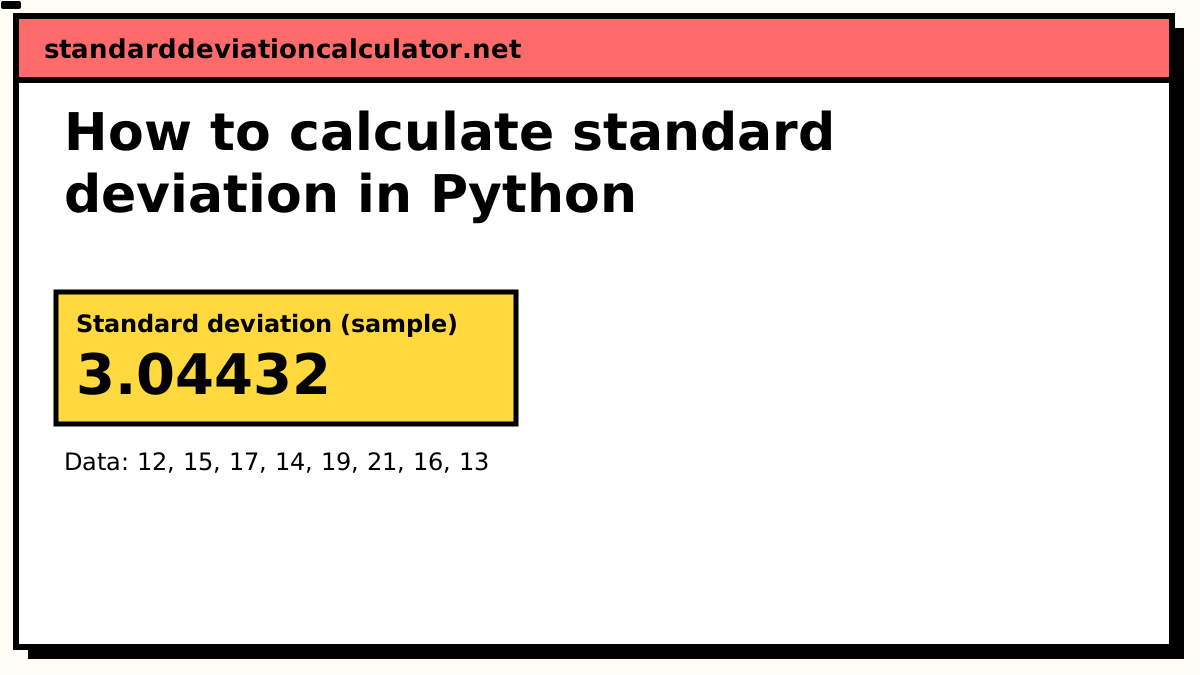
Standard deviation (sample)
3.04432
3.04
Your values typically sit about 3.04 above or below their mean of 15.88, in the same units as your data. 5 of 8 values (63%) fall between 12.83 and 18.92, within one standard deviation of the mean; for normally distributed data about 68% would.
Population SD (σ): 2.8477, if these values are the whole group.
- Count (n)
- 8
- Mean (x̄)
- 15.875
- Variance (s²)
- 9.26786
- Standard error
- 1.07633
- Minimum
- 12
- Q1 (25%)
- 13.75
- Median
- 15.5
- Q3 (75%)
- 17.5
- Maximum
- 21
- Range
- 9
More statistics (5)
- Relative SD (%RSD)
- 19.1768%
- Coefficient of variation
- 0.191768
- Sum (Σx)
- 127
- Sum of squares, Σ(x − x̄)²
- 64.875
- IQR (Q3 − Q1)
- 3.75
Data distribution
Shaded bands mark ±1, ±2 and ±3 SD from the mean. 5 of 8 values (63%) fall within ±1 SD.
Chart as text
Mean 15.875, sample standard deviation s = 3.04432, from 8 values between 12 and 21.
- Within ±1 SD (12.83 to 18.92): 5 of 8 values (63%). About 68% for normal data.
- Within ±2 SD: 8 (100%). About 95% for normal data.
- Within ±3 SD: 8 (100%). About 99.7% for normal data.
Show the working, step by step
Related calculators
-
Standard deviation calculator
Paste a list and compare it with what your script printed.
-
SD in R
sd() divides by n − 1 with no switch: the opposite trap.
-
SD in Excel
STDEV.S and STDEV.P, the pair NumPy is usually being compared against.
-
ddof=0 or ddof=1?
What the denominator means and how much it changes the answer.
Common questions
What is the difference between NumPy std and pandas std?
The default denominator. numpy.std() divides by n (population,
ddof=0); pandas.Series.std() divides by n − 1 (sample,
ddof=1). On the same eight numbers NumPy returns 2.8477 and pandas returns
3.0443. Pass ddof explicitly to either and they agree.
pandas also skips NaN by default, whereas NumPy propagates it unless you use
np.nanstd.
Does numpy.std calculate the sample or population standard deviation?
Population, unless you say otherwise. np.std(a) uses ddof=0
and divides by n. For the sample standard deviation write np.std(a, ddof=1).
Which one you want is explained here;
for most data that is a sample of something larger, it is ddof=1.
Why does NumPy give a different standard deviation from Excel?
Excel's STDEV.S divides by n − 1, NumPy's default divides by n. Add
ddof=1 and the numbers match to the last digit. The same explains any
mismatch against R's sd(), a TI-84's Sx, or the
calculator on this site, all of which report the sample value.
How do I calculate variance in Python?
statistics.variance(data) for a sample, statistics.pvariance(data)
for a population. In NumPy, np.var(a, ddof=1); in pandas,
s.var(). Variance is the squared standard deviation, so the same
ddof rules apply. The variance calculator
shows both denominators side by side.
How do I get the standard deviation of each column in a DataFrame or 2-D array?
In pandas, df.std() already returns one value per column; use
df.std(axis=1) for one value per row. In NumPy, pass
axis=0 for columns or axis=1 for rows:
m.std(axis=0, ddof=1). Without an axis NumPy flattens the whole
array into a single number.
How do I ignore NaN values when calculating standard deviation in Python?
NumPy: use np.nanstd(a, ddof=1) instead of np.std, which
returns NaN if any element is NaN. pandas already drops NaN (skipna=True
is the default) and counts only the values that remain. The statistics
module has no NaN handling at all; filter the list first with
[x for x in data if x == x] or math.isnan.
How do I calculate standard deviation in Python without a built-in function?
Compute the mean, the sum of squared deviations, divide by n − 1 for a sample (n for a population) and take the square root:
m = sum(x) / len(x); s = (sum((v - m) ** 2 for v in x) / (len(x) - 1)) ** 0.5
Frequently asked questions about standard deviation in Python
Common questions
How do I calculate standard deviation in Python?
Standard deviation is a measure of how spread out a set of numbers is around their mean. It is the square root of the average squared distance from the mean, expressed in the same units as the original data. A small standard deviation means values cluster close to the mean; a large one means they are widely scattered. See what is standard deviation for a full explanation with examples.
How do I calculate standard deviation for a filtered dataset in Python?
Standard deviation is a measure of how spread out a set of numbers is around their mean. It is the square root of the average squared distance from the mean, expressed in the same units as the original data. A small standard deviation means values cluster close to the mean; a large one means they are widely scattered. See what is standard deviation for a full explanation with examples.
How do I calculate standard deviation in JavaScript?
Standard deviation is a measure of how spread out a set of numbers is around their mean. It is the square root of the average squared distance from the mean, expressed in the same units as the original data. A small standard deviation means values cluster close to the mean; a large one means they are widely scattered. See what is standard deviation for a full explanation with examples.
How do I calculate standard deviation for a filtered dataset in JavaScript?
Standard deviation is a measure of how spread out a set of numbers is around their mean. It is the square root of the average squared distance from the mean, expressed in the same units as the original data. A small standard deviation means values cluster close to the mean; a large one means they are widely scattered. See what is standard deviation for a full explanation with examples.
How do I calculate variance and standard deviation in Python?
Standard deviation is a measure of how spread out a set of numbers is around their mean. It is the square root of the average squared distance from the mean, expressed in the same units as the original data. A small standard deviation means values cluster close to the mean; a large one means they are widely scattered. See what is standard deviation for a full explanation with examples.
How do I calculate variance and standard deviation in JavaScript?
Standard deviation is a measure of how spread out a set of numbers is around their mean. It is the square root of the average squared distance from the mean, expressed in the same units as the original data. A small standard deviation means values cluster close to the mean; a large one means they are widely scattered. See what is standard deviation for a full explanation with examples.
How do I handle blank cells when calculating standard deviation in Python?
Standard deviation is a measure of how spread out a set of numbers is around their mean. It is the square root of the average squared distance from the mean, expressed in the same units as the original data. A small standard deviation means values cluster close to the mean; a large one means they are widely scattered. See what is standard deviation for a full explanation with examples.
How do I calculate standard deviation from a frequency table in Python?
Standard deviation is a measure of how spread out a set of numbers is around their mean. It is the square root of the average squared distance from the mean, expressed in the same units as the original data. A small standard deviation means values cluster close to the mean; a large one means they are widely scattered. See what is standard deviation for a full explanation with examples.
How do I handle blank cells when calculating standard deviation in JavaScript?
Standard deviation is a measure of how spread out a set of numbers is around their mean. It is the square root of the average squared distance from the mean, expressed in the same units as the original data. A small standard deviation means values cluster close to the mean; a large one means they are widely scattered. See what is standard deviation for a full explanation with examples.
How do I calculate standard deviation from a frequency table in JavaScript?
Standard deviation is a measure of how spread out a set of numbers is around their mean. It is the square root of the average squared distance from the mean, expressed in the same units as the original data. A small standard deviation means values cluster close to the mean; a large one means they are widely scattered. See what is standard deviation for a full explanation with examples.
How do I calculate standard deviation for grouped data in Python?
Standard deviation is a measure of how spread out a set of numbers is around their mean. It is the square root of the average squared distance from the mean, expressed in the same units as the original data. A small standard deviation means values cluster close to the mean; a large one means they are widely scattered. See what is standard deviation for a full explanation with examples.
How do I calculate standard deviation for grouped data in JavaScript?
Standard deviation is a measure of how spread out a set of numbers is around their mean. It is the square root of the average squared distance from the mean, expressed in the same units as the original data. A small standard deviation means values cluster close to the mean; a large one means they are widely scattered. See what is standard deviation for a full explanation with examples.