Statistics
Sample standard deviation calculator
The sample standard deviation, s, estimates how spread out a whole population is
from a handful of its values. Paste your sample below: the calculator divides by n − 1 and shows
each step, with the population figure alongside for comparison.
Separate numbers with commas, spaces or new lines, or paste a spreadsheet column.
Decimals and negatives are fine; write 10:3 for a value that occurs 3 times.
Your results will appear here: the standard deviation first, then the rest of the summary and a chart.
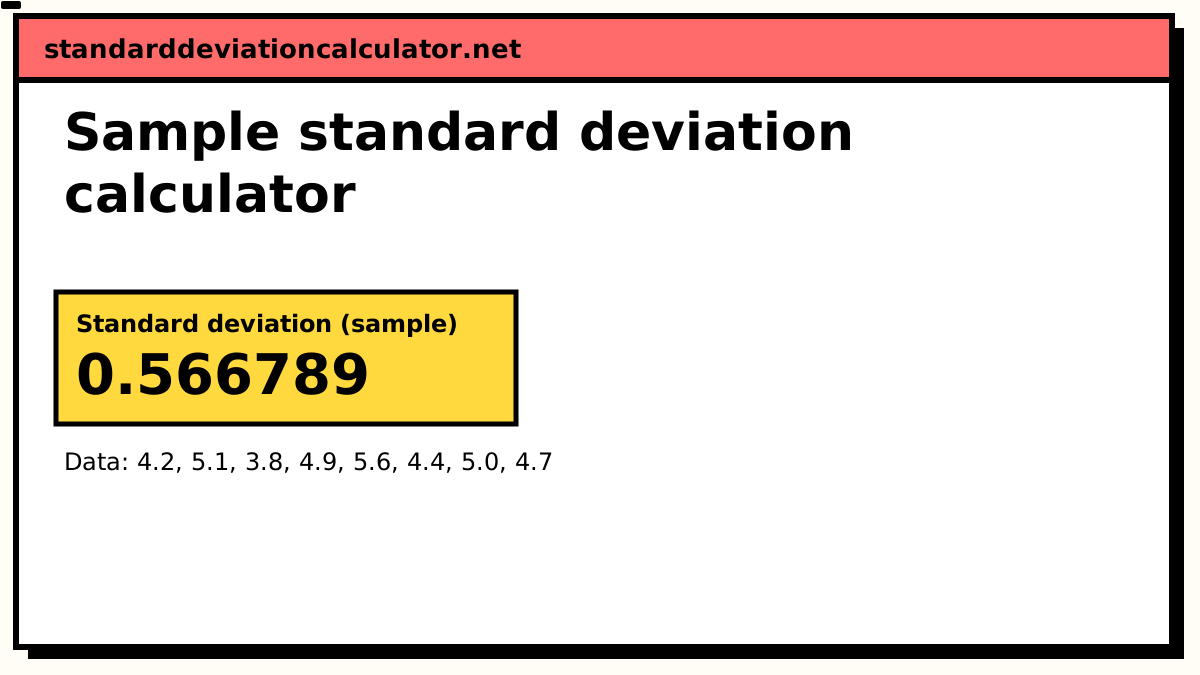
Standard deviation (sample)
0.566789
0.57
Your values typically sit about 0.567 above or below their mean of 4.712, in the same units as your data. 6 of 8 values (75%) fall between 4.146 and 5.279, within one standard deviation of the mean; for normally distributed data about 68% would.
Population SD (σ): 0.530183, if these values are the whole group.
- Count (n)
- 8
- Mean (x̄)
- 4.7125
- Variance (s²)
- 0.32125
- Standard error
- 0.20039
- Minimum
- 3.8
- Q1 (25%)
- 4.35
- Median
- 4.8
- Q3 (75%)
- 5.025
- Maximum
- 5.6
- Range
- 1.8
More statistics (5)
- Relative SD (%RSD)
- 12.0274%
- Coefficient of variation
- 0.120274
- Sum (Σx)
- 37.7
- Sum of squares, Σ(x − x̄)²
- 2.24875
- IQR (Q3 − Q1)
- 0.675
Data distribution
Shaded bands mark ±1, ±2 and ±3 SD from the mean. 6 of 8 values (75%) fall within ±1 SD.
Chart as text
Mean 4.7125, sample standard deviation s = 0.566789, from 8 values between 3.8 and 5.6.
- Within ±1 SD (4.146 to 5.279): 6 of 8 values (75%). About 68% for normal data.
- Within ±2 SD: 8 (100%). About 95% for normal data.
- Within ±3 SD: 8 (100%). About 99.7% for normal data.
Show the working, step by step
The sample standard deviation formula
s = √( Σ(x − x̄)² ÷ (n − 1) )
where x̄ is the sample mean and n the number of values. It differs
from the population formula in one place only: the denominator is n − 1, not
n.
Why n − 1: Bessel's correction
The squared deviations are measured from the sample mean, and the sample mean is by
construction the point closest to your values. Deviations from it are a little smaller than
deviations from the true population mean would be, so dividing their sum by n
would underestimate the population's spread every time. Dividing by n − 1 scales
the result up by exactly enough to cancel that bias in the variance.
Another way to see it: once you know the mean and n − 1 of the deviations, the last deviation is fixed, because they must sum to zero. Only n − 1 of them carry independent information — those are the degrees of freedom.
A worked example
A grower measures eight seedlings from a new batch, in centimetres:
4.2, 5.1, 3.8, 4.9, 5.6, 4.4, 5.0, 4.7. The batch has thousands of seedlings, so
these eight are a sample.
- Sum = 37.7 over n = 8, so the mean is x̄ = 4.7125 cm.
- The squared deviations sum to Σ(x − x̄)² = 2.24875. The largest contributions come from 3.8 (0.8327) and 5.6 (0.7877), the two values furthest from the mean.
- Divide by n − 1 = 7: s² = 0.32125 cm².
- Take the square root: s = 0.566789 cm.
Dividing by 8 instead would give σ = 0.530183 cm, about 6.5% smaller. Those numbers are loaded into the calculator above; open the working to see every squared deviation.
Sample standard deviation in Excel, calculators and code
| Tool | Sample SD (n − 1) | Watch out for |
|---|---|---|
| Excel, Google Sheets | =STDEV.S(A1:A8) | Old STDEV is the same thing; STDEV.P is the population version |
| TI-83 / TI-84 | Sx | 1-Var Stats lists σx directly below it |
| Casio fx series | sx (or xσn−1) | σx / xσn is the population version |
| Python (NumPy) | np.std(x, ddof=1) | The default ddof=0 gives the population SD |
| Python (pandas) | df['x'].std() | pandas defaults to n − 1, unlike NumPy |
| R | sd(x) | Always n − 1; there is no population switch |
The guides for Excel, the TI-84 and Python cover each in detail.
When the sample standard deviation is the wrong choice
If the values really are the entire group you care about — all twelve students in one class, every batch in a closed lot — nothing is being estimated, and the population formula is correct. The population standard deviation calculator handles that case. When in doubt, the sample version is the safer default: it is what reviewers and examiners expect unless the question says otherwise.
Related calculators
-
Population standard deviation
The same data divided by n, for when you have every member of the group.
-
Sample variance
s², the step before the square root.
-
Sample vs population
How to choose between the two, with examples.
-
Standard deviation calculator
The general calculator, with both modes and a dot plot.
Common questions
How do I know my data is a sample?
Ask what you want the number to describe. If the answer is a bigger group than the
values in front of you — every seedling of that variety, every part the machine will make,
every customer — then your values are a sample and you want s. That covers
almost every experiment, survey and quality check.
What does the s in the sample standard deviation stand for?
Just "sample". By convention Latin letters (s, x̄) describe a
sample and Greek letters (σ, μ) describe a population. Calculators
label it Sx or sx, and Excel calls the function
STDEV.S.
Is the sample standard deviation always bigger than the population one?
For the same values, yes, unless every value is identical (then both are 0). The ratio is
fixed: s = σ × √(n / (n − 1)). With 8 values that is a factor of 1.069; with
100 values it is only 1.005, which is why the choice matters most for small samples.
Does dividing by n − 1 make the sample SD unbiased?
It makes the sample variance unbiased: on average, s² equals the
population variance. The square root reintroduces a small downward bias in s
itself, a few percent for tiny samples and negligible beyond about 30 values. It is still
the standard estimator, and the one every textbook, journal and software package means by
"sample standard deviation".
What is the sample standard deviation of a single value?
It is undefined. The formula divides by n − 1, which is zero when n = 1, and one value cannot tell you anything about spread. The calculator will ask for at least two numbers in sample mode.