How to calculate standard deviation
Find the mean, measure how far each value sits from it, square those distances, average them, and take the square root. That is the whole method. This page works through it twice on real numbers, covers the case where the mean is already known, lists the mistakes that produce wrong answers, and ends with four practice problems you can check.
The steps
- Find the mean. Add every value and divide by how many there are.
- Subtract the mean from each value. These are the deviations. Some will be negative; that is expected.
- Square each deviation. Every result is now zero or positive.
- Add the squared deviations together.
- Divide by n − 1 if the data is a sample, or by n if it is the whole population. This is the variance.
- Take the square root. This is the standard deviation.
Written as a formula, for a sample of n values with mean x̄:
s = √[ Σ(x − x̄)² / (n − 1) ]
The population version replaces x̄ with μ and n − 1 with N; nothing else changes. If any of the symbols is unfamiliar, the formula page takes the expression apart term by term. Here the point is the arithmetic, so on to a real dataset.
Worked example 1: sample standard deviation
Seven pupils sit a quiz marked out of 10 and score 4, 8, 6, 5, 3, 7, 9. They
are seven pupils out of a much larger year group, so this is a sample and the denominator
will be n − 1.
Step 1: the mean. The scores add to 4 + 8 + 6 + 5 + 3 + 7 + 9 = 42, and there are 7 of them, so x̄ = 42 ÷ 7 = 6.
Steps 2 and 3: deviations and squares. Subtract 6 from each score, then square the result. Laying this out as a table is the single best habit for doing the calculation by hand, because each column checks the one before it.
| Value, x | Deviation, x − 6 | Squared, (x − 6)² |
|---|---|---|
| 4 | −2 | 4 |
| 8 | 2 | 4 |
| 6 | 0 | 0 |
| 5 | −1 | 1 |
| 3 | −3 | 9 |
| 7 | 1 | 1 |
| 9 | 3 | 9 |
| Σ = 42 | Σ = 0 | Σ = 28 |
The middle column totals zero. It always does: the deviations above the mean exactly balance the ones below it. So if yours does not, the mean was wrong and there is no point going further. The squared column is what you want: Σ(x − x̄)² = 28.
Step 5: divide. This is a sample of 7, so divide by n − 1 = 6: 28 ÷ 6 = 4.6667. That is the sample variance, s².
Step 6: square root. √4.6667 = 2.1602. The sample standard deviation of the seven scores is s ≈ 2.16 marks.
s = √(28 / 6) = √4.6667 = 2.1602
Had these seven been the entire class rather than a sample, step 5 would divide by 7 instead: 28 ÷ 7 = 4 and √4 = 2 exactly. Same data, same working, different denominator, and the answer moves from 2.16 to 2.00, which is why the sample-or-population question is settled before the arithmetic starts, not after.
The calculator below is loaded with the same seven numbers. Toggle it between sample and population to see the denominator change, or replace them with your own data and compare its working against yours line by line.
Separate numbers with commas, spaces or new lines, or paste a spreadsheet column.
Decimals and negatives are fine; write 10:3 for a value that occurs 3 times.
Your results will appear here: the standard deviation first, then the rest of the summary and a chart.
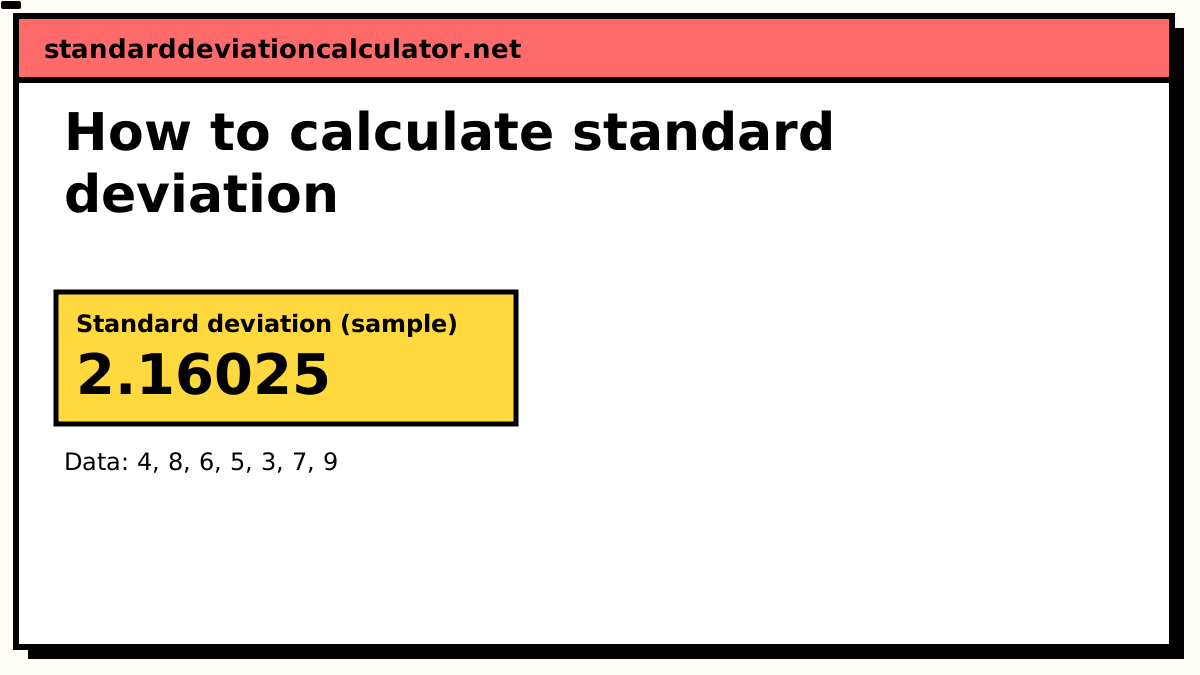
Standard deviation (sample)
2.16025
2.16
Your values typically sit about 2.16 above or below their mean of 6, in the same units as your data. 5 of 7 values (71%) fall between 3.84 and 8.16, within one standard deviation of the mean; for normally distributed data about 68% would.
Population SD (σ): 2, if these values are the whole group.
- Count (n)
- 7
- Mean (x̄)
- 6
- Variance (s²)
- 4.66667
- Standard error
- 0.816497
- Minimum
- 3
- Q1 (25%)
- 4.5
- Median
- 6
- Q3 (75%)
- 7.5
- Maximum
- 9
- Range
- 6
More statistics (5)
- Relative SD (%RSD)
- 36.0041%
- Coefficient of variation
- 0.360041
- Sum (Σx)
- 42
- Sum of squares, Σ(x − x̄)²
- 28
- IQR (Q3 − Q1)
- 3
Data distribution
Shaded bands mark ±1, ±2 and ±3 SD from the mean. 5 of 7 values (71%) fall within ±1 SD.
Chart as text
Mean 6, sample standard deviation s = 2.16025, from 7 values between 3 and 9.
- Within ±1 SD (3.84 to 8.16): 5 of 7 values (71%). About 68% for normal data.
- Within ±2 SD: 7 (100%). About 95% for normal data.
- Within ±3 SD: 7 (100%). About 99.7% for normal data.
Show the working, step by step
Worked example 2: population standard deviation
A committee has five members, aged 34, 41, 29, 38, 33. Every member is
included and there is no larger group being estimated, so this is a population and the
denominator is N.
- Sum = 34 + 41 + 29 + 38 + 33 = 175. Mean μ = 175 ÷ 5 = 35.
- Deviations from 35: −1, 6, −6, 3, −2. (Check: they sum to 0.)
- Squared: 1, 36, 36, 9, 4.
- Sum of squares = 1 + 36 + 36 + 9 + 4 = 86.
- Divide by N = 5: 86 ÷ 5 = 17.2. This is the population variance, σ².
- Square root: √17.2 = 4.1473.
σ = √(86 / 5) = √17.2 = 4.1473
The population standard deviation is σ ≈ 4.15 years. For comparison, the sample formula on the same ages would give √(86 ÷ 4) = √21.5 = 4.6368, about 12% higher, which is typical of the gap at n = 5.
If you already know the mean
Search for "standard deviation from the mean" and you will find two different questions hiding behind the phrase. The first is: the mean has been given to me, what do I do with it? The answer is that you skip step 1 and nothing else. You still need every individual value, because steps 2 to 6 are done on the values, not on the mean.
Suppose you are told a set of five readings has a mean of 20, and the readings are
17, 22, 19, 24, 18. Deviations from 20 are −3, 2, −1, 4, −2. Squared they are
9, 4, 1, 16, 4, which sum to 34. As a sample: 34 ÷ 4 = 8.5, and √8.5 =
2.9155. As a population: 34 ÷ 5 = 6.8, and √6.8 = 2.6077.
The second question is: I have only the mean, can I work out the standard deviation from it?
No. The mean tells you where the data is centred and nothing about how far it is spread. The
sets 19, 20, 21 and 0, 20, 40 both have a mean of 20; their sample
standard deviations are 1 and 20. You need the values, or at the very least the variance,
the sum of squared deviations, or a standard error together with n.
One subtlety worth knowing. If the mean you were given is a rounded figure, the deviations inherit the rounding and the final answer drifts. Where you can recompute the mean exactly from the values, do so. And if the mean is a known population mean supplied from outside the data, rather than one calculated from these values, divide by n rather than n − 1: the correction exists to compensate for measuring spread around the sample's own mean, and it is not needed when you did not.
How do you estimate the standard deviation from the range?
If you only know the smallest value, the largest value and how many values there were, divide the range by a number that depends on the sample size. For about 25 to 30 values that number is close to 4, which is where the "range ÷ 4" rule of thumb comes from.
The divisor has to grow with the sample, because a bigger sample reaches further into the tails: ten values from a normal distribution typically span about 3.1 standard deviations, a hundred span about 5. So ÷ 4 understates the SD of a 10-value sample by about a quarter and overstates the SD of a 100-value sample by about a quarter. The estimator below adjusts for n. It assumes roughly normal data and is only an estimate; with the raw values, use the standard deviation calculator for the real answer.
Show the working, step by step
Find the range.
range = 48 − 12 = 36
A bigger sample is expected to reach further into the tails, so its range covers more standard deviations. The divisor for n values from a normal distribution is
ξ(n) = 2 × Φ⁻¹((n − 0.375) ÷ (n + 0.25)) ξ(25) = 3.9284
Divide the range by it.
s ≈ 36 ÷ 3.9284 = 9.16396
This is the Wan et al. (2014) estimator. The classroom shortcut, range ÷ 4, matches it only for samples of about 25 to 30. Both assume roughly normal data and are estimates: with the raw values, use the standard deviation calculator instead.
Sample or population: how to decide
Ask one question: do these values make up the entire group I am describing, or are they a subset I am using to say something about a larger group? Twelve blood-pressure readings from a clinic are a sample of that clinic's patients. The heights of all twenty-three players in a squad, when the question is about that squad, are a population. The same numbers can be either; it depends on what claim you are making, not on the data itself.
When in doubt, treat the data as a sample. Almost every dataset in science, business and
coursework is one, and the sample formula is what STDEV.S, a TI-84's
Sx and the default on this site all compute. The choice matters most for small
n, where dividing by n − 1 rather than n changes the answer by more than 10% at n = 5, and
hardly at all above a few hundred values.
The full guide to deciding is here,
including a table of the gap at each n.
By hand, or with a calculator or spreadsheet
Working through the table by hand is worth doing a few times, because it is the only way to
really understand what the number means, and it is what an exam expects. Beyond about ten
values, though, hand arithmetic is slow and error-prone, and a tool is the right choice.
Excel and Google Sheets do it in one cell: =STDEV.S(A1:A20) for a sample,
=STDEV.P(A1:A20) for a population.
The Excel guide covers the functions and
the text-stored-as-number trap that silently drops rows.
On a TI-84, enter the data in a list and run 1-Var Stats; Sx is the sample
standard deviation and σx the population one.
The TI-84 guide has the keystrokes. And
the standard deviation calculator shows each of the six steps with the intermediate
numbers, which makes it a good way to check hand working before an exam.
Common mistakes
- Forgetting to square. The raw deviations sum to zero, so an unsquared version gives 0 for every dataset. If your total in step 4 is zero, this is why.
- Dividing by n for a sample. The most common error in coursework. It gives the population figure, which is always slightly too small for a sample. Decide sample or population before you start and write the denominator down.
- Taking the square root too early. Rooting each squared deviation individually just undoes step 3 and returns the absolute deviations. The root is taken once, at the end, of the whole average.
- Rounding intermediate steps. Keep at least four decimal places in the mean and the variance, and round only the final answer. A rounded mean nudges every deviation, and the errors compound through the squaring.
- Mixing units. All values must be in the same unit before you begin. Standard deviation carries the unit of the data, so a mix of centimetres and metres gives a meaningless number.
- Treating the range as the standard deviation. Largest minus smallest is the range, a different and much cruder measure. The SD is always smaller than the range and, for most data, roughly a quarter of it.
Practice problems
Each answer gives the mean and the sample standard deviation, with the population figure where asked. Work them on paper with the three-column table, then check. Rounded to three decimal places; if you rounded earlier your answer may differ in the last digit. For more, the printable standard deviation worksheets have four graded sets with answer keys, the online practice problems mark each answer as you go, and ten worked examples apply the method to real data.
Problem 1
Six delivery times, in minutes: 10, 12, 15, 11, 17, 13. Find the mean and the sample standard deviation.
Show answer
Sum = 78, n = 6, mean = 13. Deviations: −3, −1, 2, −2, 4, 0. Squared: 9, 1, 4, 4, 16, 0. Sum of squares = 34.
Sample variance = 34 ÷ 5 = 6.8. s = √6.8 = 2.608.
Problem 2
Six measured lengths, in centimetres: 2.5, 3.1, 2.8, 3.4, 2.2, 3.0. Find the mean and the sample standard deviation.
Show answer
Sum = 17.0, n = 6, mean = 2.8333. Deviations: −0.3333, 0.2667, −0.0333, 0.5667, −0.6333, 0.1667. Squared: 0.1111, 0.0711, 0.0011, 0.3211, 0.4011, 0.0278. Sum of squares = 0.9333.
Sample variance = 0.9333 ÷ 5 = 0.1867. s = √0.1867 = 0.432 cm. Keep the mean as a fraction (17/6) or to four decimals rather than rounding it early.
Problem 3
Eight test scores: 45, 52, 38, 60, 49, 41, 55, 50. Find the mean, then both the sample and the population standard deviation.
Show answer
Sum = 390, n = 8, mean = 48.75. Deviations: −3.75, 3.25, −10.75, 11.25, 0.25, −7.75, 6.25, 1.25. Squared: 14.0625, 10.5625, 115.5625, 126.5625, 0.0625, 60.0625, 39.0625, 1.5625. Sum of squares = 367.5.
Sample: 367.5 ÷ 7 = 52.5, s = √52.5 = 7.246. Population: 367.5 ÷ 8 = 45.9375, σ = √45.9375 = 6.778.
Problem 4
Eight overnight temperatures, in °C: −5, 3, 0, 7, −2, 6, 1, 6. Find the mean and the sample standard deviation. Watch the signs.
Show answer
Sum = 16, n = 8, mean = 2. Deviations: −7, 1, −2, 5, −4, 4, −1, 4. Squared: 49, 1, 4, 25, 16, 16, 1, 16. Sum of squares = 128.
Sample variance = 128 ÷ 7 = 18.2857. s = √18.2857 = 4.276 °C. Negative values behave no differently: −5 − 2 = −7, and (−7)² = 49.
Related calculators
-
Standard deviation calculator
Paste your numbers and see every step of the working.
-
The standard deviation formula
Both formulas term by term, and why each operation is there.
-
Sample vs population
How to decide, and how much the denominator changes the answer.
-
Variance calculator
The same calculation, stopped before the square root.
Common questions
What are the steps to calculate standard deviation?
Six steps: find the mean; subtract the mean from each value; square each of those deviations; add the squares up; divide by n − 1 for a sample or by n for a population; take the square root. The number before the square root is the variance, so the standard deviation is always the square root of the variance.
How do I calculate standard deviation by hand?
Write the values in a column, put the mean at the top, and add two more columns: one for each value minus the mean, one for that difference squared. Total the squared column, divide by n − 1 (or n for a population), and take the square root. Before squaring, check that the deviation column sums to zero. If it does not, the mean is wrong.
How do I calculate standard deviation from the mean?
You cannot get it from the mean alone: the mean says where the data is centred, not how widely it is spread, and two datasets with the same mean can have completely different standard deviations. What you can do, if the mean is given, is skip step one. Subtract the known mean from each value, square, sum, divide and root exactly as usual.
Should I use the sample or population formula?
Use the sample formula (divide by n − 1) when your values are a subset of a larger group you want to describe, which is nearly every real dataset. Use the population formula (divide by n) only when the values are the complete group and nothing is left out. If you are unsure, sample is the safer default. The full comparison is here.
Why divide by n − 1 instead of n?
Because a sample's mean is fitted to that sample, the values sit slightly closer to it than they do to the true population mean, so the squared deviations come out a little too small on average. Dividing by n − 1 rather than n enlarges the result by exactly enough to cancel that bias. The correction matters a lot for small n and hardly at all for large n.
Why are the deviations squared?
Because the raw deviations from the mean always sum to zero, for any dataset, so their average is zero and tells you nothing. Squaring makes every term positive so the spread cannot cancel out. The square root at the end returns the answer to the original units. The standard deviation formula page explains each term.
Is there a quick way to calculate standard deviation?
For an exact answer, no: every value has to be used. For a rough check, divide the range by 4 (the range rule), which works for moderately sized, roughly bell-shaped data. A calculator or the standard deviation calculator gives the exact figure in one step.
How do I find standard deviation on a TI-30X IIS, TI-30XS or TI-36X Pro?
Enter the values in the data list, run one-variable statistics (1-Var Stats), and read the results: Sx is the sample standard deviation (n − 1) and σx the population one (N). The key labels differ slightly between models, but all three use these names.
How do I calculate standard deviation in MATLAB?
std(x) returns the sample standard deviation (dividing by n − 1); std(x, 1) returns the population standard deviation (dividing by n).
How do I find s²?
s² is the sample variance: add up the squared deviations from the mean and divide by n − 1, or square the sample standard deviation. The variance formula page works an example.
How is standard deviation written in short form?
SD in text and tables ("mean 24.1, SD 3.2"), s for a sample and σ for a population in formulas, and STDEV in spreadsheets.
How do I calculate the standard deviation of a stock index such as Nifty?
Take the closing prices, turn them into daily returns, and find the standard deviation of those returns. Multiply by √252 to annualise a daily figure. The guide to standard deviation in finance shows the steps.
Questions about how to calculate standard deviation
Common questions
Can a standard deviation calculator handle a table with class midpoints?
Standard deviation is a measure of how spread out a set of numbers is around their mean. It is the square root of the average squared distance from the mean, expressed in the same units as the original data. A small standard deviation means values cluster close to the mean; a large one means they are widely scattered. See what is standard deviation for a full explanation with examples.
Can a standard deviation calculator handle a dataset with missing values?
For datasets with missing values, you can exclude them pairwise or use listwise deletion. The standard deviation calculator ignores blank entries automatically.
Can a standard deviation calculator handle a dataset with repeated observations?
When values repeat, you can enter each occurrence individually or use a frequency table. Both give the same result. The frequency table standard deviation calculator is more efficient for datasets with many repeated values.
Can a standard deviation calculator handle a very small sample?
Standard deviation is a measure of how spread out a set of numbers is around their mean. It is the square root of the average squared distance from the mean, expressed in the same units as the original data. A small standard deviation means values cluster close to the mean; a large one means they are widely scattered. See what is standard deviation for a full explanation with examples.
Can a standard deviation calculator handle streaming data?
For streaming SD calculation, use Welford's algorithm, which updates incrementally as each new value arrives, avoiding the need to store all values. The large dataset standard deviation calculator uses this method.
Can a standard deviation calculator handle a list with zero values?
Zero values in a dataset are handled normally: subtract the mean from zero and square. Zeros do not need special treatment. Use the standard deviation calculator with any mix of values.
Can a standard deviation calculator handle a list with negative values?
Standard deviation handles negative numbers normally: the squaring step makes deviations positive. Enter negative values with the minus sign. Use the standard deviation calculator with any mix of values.
Can a standard deviation calculator handle a dataset with different measurement units?
If your dataset contains different measurement units, SD is not meaningful: it is expressed in the same units as the data. Convert all values to the same unit, or use the relative standard deviation calculator for a unitless comparison of spread.
Can a standard deviation calculator handle a dataset containing only one observation?
Standard deviation is a measure of how spread out a set of numbers is around their mean. It is the square root of the average squared distance from the mean, expressed in the same units as the original data. A small standard deviation means values cluster close to the mean; a large one means they are widely scattered. See what is standard deviation for a full explanation with examples.
How is standard deviation calculated in stock returns?
Standard deviation is a measure of how spread out a set of numbers is around their mean. It is the square root of the average squared distance from the mean, expressed in the same units as the original data. A small standard deviation means values cluster close to the mean; a large one means they are widely scattered. See what is standard deviation for a full explanation with examples.
How is standard deviation calculated in investment risk?
In finance, SD is the standard measure of volatility. A high SD means volatile returns (higher risk). The Sharpe ratio divides excess return by SD. Portfolio SD depends on individual asset SDs and their correlations. See standard deviation in finance.
How is standard deviation calculated in process capability?
In quality control, SD measures process consistency. Six Sigma targets no more than 3.4 defects per million by keeping variation within six SDs of the mean. See Cpk and the process capability calculators for quality scoring.
How is standard deviation calculated in laboratory measurements?
In biology, SD measures variation in measurements such as cell size, enzyme activity, or population traits. Error bars on graphs typically show ±1 SD. A small SD indicates consistent measurements. See standard deviation use cases for more.
What should a beginner know about using standard deviation to compare datasets?
Standard deviation is used across many fields to measure variability. See standard deviation use cases for domain-specific applications.
What should a beginner know about the limits of standard deviation?
Standard deviation is used across many fields to measure variability. See standard deviation use cases for domain-specific applications.
What should a college student know about using standard deviation to compare datasets?
Standard deviation is used across many fields to measure variability. See standard deviation use cases for domain-specific applications.
What should a college student know about the limits of standard deviation?
Standard deviation is used across many fields to measure variability. See standard deviation use cases for domain-specific applications.
What should a researcher know about using standard deviation to compare datasets?
Standard deviation is used across many fields to measure variability. See standard deviation use cases for domain-specific applications.
What should a researcher know about the limits of standard deviation?
Standard deviation is used across many fields to measure variability. See standard deviation use cases for domain-specific applications.
What should a data analyst know about using standard deviation to compare datasets?
Standard deviation is used across many fields to measure variability. See standard deviation use cases for domain-specific applications.
What should a data analyst know about the limits of standard deviation?
Standard deviation is used across many fields to measure variability. See standard deviation use cases for domain-specific applications.
What should a teacher preparing a lesson know about using standard deviation to compare datasets?
Standard deviation is used across many fields to measure variability. See standard deviation use cases for domain-specific applications.
What should a teacher preparing a lesson know about the limits of standard deviation?
Standard deviation is used across many fields to measure variability. See standard deviation use cases for domain-specific applications.
What should a business analyst know about using standard deviation to compare datasets?
Standard deviation is used across many fields to measure variability. See standard deviation use cases for domain-specific applications.
What should a business analyst know about the limits of standard deviation?
Standard deviation is used across many fields to measure variability. See standard deviation use cases for domain-specific applications.
How do I calculate standard deviation in R?
Standard deviation is a measure of how spread out a set of numbers is around their mean. It is the square root of the average squared distance from the mean, expressed in the same units as the original data. A small standard deviation means values cluster close to the mean; a large one means they are widely scattered. See what is standard deviation for a full explanation with examples.
How do I calculate standard deviation for a filtered dataset in R?
Standard deviation is a measure of how spread out a set of numbers is around their mean. It is the square root of the average squared distance from the mean, expressed in the same units as the original data. A small standard deviation means values cluster close to the mean; a large one means they are widely scattered. See what is standard deviation for a full explanation with examples.
How do I calculate standard deviation in Java?
Standard deviation is a measure of how spread out a set of numbers is around their mean. It is the square root of the average squared distance from the mean, expressed in the same units as the original data. A small standard deviation means values cluster close to the mean; a large one means they are widely scattered. See what is standard deviation for a full explanation with examples.
How do I calculate standard deviation for a filtered dataset in Java?
Standard deviation is a measure of how spread out a set of numbers is around their mean. It is the square root of the average squared distance from the mean, expressed in the same units as the original data. A small standard deviation means values cluster close to the mean; a large one means they are widely scattered. See what is standard deviation for a full explanation with examples.
How do I calculate standard deviation in C++?
Standard deviation is a measure of how spread out a set of numbers is around their mean. It is the square root of the average squared distance from the mean, expressed in the same units as the original data. A small standard deviation means values cluster close to the mean; a large one means they are widely scattered. See what is standard deviation for a full explanation with examples.
How do I calculate standard deviation for a filtered dataset in C++?
Standard deviation is a measure of how spread out a set of numbers is around their mean. It is the square root of the average squared distance from the mean, expressed in the same units as the original data. A small standard deviation means values cluster close to the mean; a large one means they are widely scattered. See what is standard deviation for a full explanation with examples.
How do I calculate standard deviation in SQL?
Standard deviation is a measure of how spread out a set of numbers is around their mean. It is the square root of the average squared distance from the mean, expressed in the same units as the original data. A small standard deviation means values cluster close to the mean; a large one means they are widely scattered. See what is standard deviation for a full explanation with examples.
How do I calculate standard deviation for a filtered dataset in SQL?
Standard deviation is a measure of how spread out a set of numbers is around their mean. It is the square root of the average squared distance from the mean, expressed in the same units as the original data. A small standard deviation means values cluster close to the mean; a large one means they are widely scattered. See what is standard deviation for a full explanation with examples.
How do I calculate standard deviation for a dataset with missing values?
For datasets with missing values, you can exclude them pairwise or use listwise deletion. The standard deviation calculator ignores blank entries automatically.
How do I calculate standard deviation for a dataset with repeated observations?
When values repeat, you can enter each occurrence individually or use a frequency table. Both give the same result. The frequency table standard deviation calculator is more efficient for datasets with many repeated values.
How do I calculate standard deviation for a very small sample?
Standard deviation is a measure of how spread out a set of numbers is around their mean. It is the square root of the average squared distance from the mean, expressed in the same units as the original data. A small standard deviation means values cluster close to the mean; a large one means they are widely scattered. See what is standard deviation for a full explanation with examples.
How do I calculate standard deviation for a large population?
Standard deviation is a measure of how spread out a set of numbers is around their mean. It is the square root of the average squared distance from the mean, expressed in the same units as the original data. A small standard deviation means values cluster close to the mean; a large one means they are widely scattered. See what is standard deviation for a full explanation with examples.
How do I calculate standard deviation for streaming data?
For streaming SD calculation, use Welford's algorithm, which updates incrementally as each new value arrives, avoiding the need to store all values. The large dataset standard deviation calculator uses this method.
How do I calculate standard deviation for a list with zero values?
Zero values in a dataset are handled normally: subtract the mean from zero and square. Zeros do not need special treatment. Use the standard deviation calculator with any mix of values.
How do I calculate standard deviation for a list with negative values?
Standard deviation handles negative numbers normally: the squaring step makes deviations positive. Enter negative values with the minus sign. Use the standard deviation calculator with any mix of values.
How do I calculate standard deviation for a dataset with different measurement units?
If your dataset contains different measurement units, SD is not meaningful: it is expressed in the same units as the data. Convert all values to the same unit, or use the relative standard deviation calculator for a unitless comparison of spread.
How do I calculate standard deviation for a dataset containing only one observation?
Standard deviation is a measure of how spread out a set of numbers is around their mean. It is the square root of the average squared distance from the mean, expressed in the same units as the original data. A small standard deviation means values cluster close to the mean; a large one means they are widely scattered. See what is standard deviation for a full explanation with examples.
How do I calculate standard error from standard deviation and sample size?
Standard deviation is a measure of how spread out a set of numbers is around their mean. It is the square root of the average squared distance from the mean, expressed in the same units as the original data. A small standard deviation means values cluster close to the mean; a large one means they are widely scattered. See what is standard deviation for a full explanation with examples.
How do I calculate standard deviation by hand?
Standard deviation is a measure of how spread out a set of numbers is around their mean. It is the square root of the average squared distance from the mean, expressed in the same units as the original data. A small standard deviation means values cluster close to the mean; a large one means they are widely scattered. See what is standard deviation for a full explanation with examples.
How do I calculate sample mean and standard deviation together?
Standard deviation is a measure of how spread out a set of numbers is around their mean. It is the square root of the average squared distance from the mean, expressed in the same units as the original data. A small standard deviation means values cluster close to the mean; a large one means they are widely scattered. See what is standard deviation for a full explanation with examples.
What should a beginner know about the meaning of standard deviation?
Standard deviation is used across many fields to measure variability. See standard deviation use cases for domain-specific applications.
What should a college student know about the meaning of standard deviation?
Standard deviation is used across many fields to measure variability. See standard deviation use cases for domain-specific applications.
What should a researcher know about the meaning of standard deviation?
Standard deviation is used across many fields to measure variability. See standard deviation use cases for domain-specific applications.
What should a data analyst know about the meaning of standard deviation?
Standard deviation is used across many fields to measure variability. See standard deviation use cases for domain-specific applications.
What should a teacher preparing a lesson know about the meaning of standard deviation?
Standard deviation is used across many fields to measure variability. See standard deviation use cases for domain-specific applications.
What should a business analyst know about the meaning of standard deviation?
Standard deviation is used across many fields to measure variability. See standard deviation use cases for domain-specific applications.
What should a quality-control engineer know about the meaning of standard deviation?
Standard deviation is used across many fields to measure variability. See standard deviation use cases for domain-specific applications.
What should someone preparing for a statistics exam know about the meaning of standard deviation?
Standard deviation is used across many fields to measure variability. See standard deviation use cases for domain-specific applications.
What should someone preparing for a statistics exam know about interpreting a standard deviation value?
Standard deviation is used across many fields to measure variability. See standard deviation use cases for domain-specific applications.
What should someone preparing for a statistics exam know about using standard deviation to compare datasets?
Standard deviation is used across many fields to measure variability. See standard deviation use cases for domain-specific applications.
What should someone preparing for a statistics exam know about the limits of standard deviation?
Standard deviation is used across many fields to measure variability. See standard deviation use cases for domain-specific applications.
What should someone preparing for a statistics exam know about standard deviation and outliers?
Standard deviation is used across many fields to measure variability. See standard deviation use cases for domain-specific applications.
What should a high-school student know about the meaning of standard deviation?
Standard deviation is used across many fields to measure variability. See standard deviation use cases for domain-specific applications.
What should a high-school student know about interpreting a standard deviation value?
Standard deviation is used across many fields to measure variability. See standard deviation use cases for domain-specific applications.
What should a high-school student know about using standard deviation to compare datasets?
Standard deviation is used across many fields to measure variability. See standard deviation use cases for domain-specific applications.
What should a high-school student know about the limits of standard deviation?
Standard deviation is used across many fields to measure variability. See standard deviation use cases for domain-specific applications.
Can a standard deviation calculator handle a large population?
Standard deviation is a measure of how spread out a set of numbers is around their mean. It is the square root of the average squared distance from the mean, expressed in the same units as the original data. A small standard deviation means values cluster close to the mean; a large one means they are widely scattered. See what is standard deviation for a full explanation with examples.
How do I calculate variance and standard deviation in Java?
Standard deviation is a measure of how spread out a set of numbers is around their mean. It is the square root of the average squared distance from the mean, expressed in the same units as the original data. A small standard deviation means values cluster close to the mean; a large one means they are widely scattered. See what is standard deviation for a full explanation with examples.
How do I calculate variance and standard deviation in C++?
Standard deviation is a measure of how spread out a set of numbers is around their mean. It is the square root of the average squared distance from the mean, expressed in the same units as the original data. A small standard deviation means values cluster close to the mean; a large one means they are widely scattered. See what is standard deviation for a full explanation with examples.
How do I calculate variance and standard deviation in SQL?
Standard deviation is a measure of how spread out a set of numbers is around their mean. It is the square root of the average squared distance from the mean, expressed in the same units as the original data. A small standard deviation means values cluster close to the mean; a large one means they are widely scattered. See what is standard deviation for a full explanation with examples.
What should a beginner know about the relationship between variance and standard deviation?
Standard deviation is used across many fields to measure variability. See standard deviation use cases for domain-specific applications.
What should a high-school student know about the relationship between variance and standard deviation?
Standard deviation is used across many fields to measure variability. See standard deviation use cases for domain-specific applications.
What should a college student know about the relationship between variance and standard deviation?
Standard deviation is used across many fields to measure variability. See standard deviation use cases for domain-specific applications.
What should a researcher know about the relationship between variance and standard deviation?
Standard deviation is used across many fields to measure variability. See standard deviation use cases for domain-specific applications.
What should a data analyst know about the relationship between variance and standard deviation?
Standard deviation is used across many fields to measure variability. See standard deviation use cases for domain-specific applications.
What should a teacher preparing a lesson know about the relationship between variance and standard deviation?
Standard deviation is used across many fields to measure variability. See standard deviation use cases for domain-specific applications.
What should someone preparing for a statistics exam know about the relationship between variance and standard deviation?
Standard deviation is used across many fields to measure variability. See standard deviation use cases for domain-specific applications.
What should a business analyst know about the relationship between variance and standard deviation?
Standard deviation is used across many fields to measure variability. See standard deviation use cases for domain-specific applications.
How do I calculate standard deviation from a frequency table in R?
Standard deviation is a measure of how spread out a set of numbers is around their mean. It is the square root of the average squared distance from the mean, expressed in the same units as the original data. A small standard deviation means values cluster close to the mean; a large one means they are widely scattered. See what is standard deviation for a full explanation with examples.
How do I handle blank cells when calculating standard deviation in Java?
Standard deviation is a measure of how spread out a set of numbers is around their mean. It is the square root of the average squared distance from the mean, expressed in the same units as the original data. A small standard deviation means values cluster close to the mean; a large one means they are widely scattered. See what is standard deviation for a full explanation with examples.
How do I calculate standard deviation from a frequency table in Java?
Standard deviation is a measure of how spread out a set of numbers is around their mean. It is the square root of the average squared distance from the mean, expressed in the same units as the original data. A small standard deviation means values cluster close to the mean; a large one means they are widely scattered. See what is standard deviation for a full explanation with examples.
How do I handle blank cells when calculating standard deviation in C++?
Standard deviation is a measure of how spread out a set of numbers is around their mean. It is the square root of the average squared distance from the mean, expressed in the same units as the original data. A small standard deviation means values cluster close to the mean; a large one means they are widely scattered. See what is standard deviation for a full explanation with examples.
How do I calculate standard deviation from a frequency table in C++?
Standard deviation is a measure of how spread out a set of numbers is around their mean. It is the square root of the average squared distance from the mean, expressed in the same units as the original data. A small standard deviation means values cluster close to the mean; a large one means they are widely scattered. See what is standard deviation for a full explanation with examples.
How do I handle blank cells when calculating standard deviation in SQL?
Standard deviation is a measure of how spread out a set of numbers is around their mean. It is the square root of the average squared distance from the mean, expressed in the same units as the original data. A small standard deviation means values cluster close to the mean; a large one means they are widely scattered. See what is standard deviation for a full explanation with examples.
How do I calculate standard deviation from a frequency table in SQL?
Standard deviation is a measure of how spread out a set of numbers is around their mean. It is the square root of the average squared distance from the mean, expressed in the same units as the original data. A small standard deviation means values cluster close to the mean; a large one means they are widely scattered. See what is standard deviation for a full explanation with examples.
What should I check before calculating standard deviation for a table with class midpoints?
Standard deviation is a measure of how spread out a set of numbers is around their mean. It is the square root of the average squared distance from the mean, expressed in the same units as the original data. A small standard deviation means values cluster close to the mean; a large one means they are widely scattered. See what is standard deviation for a full explanation with examples.
What should I check before calculating standard deviation for a dataset with missing values?
For datasets with missing values, you can exclude them pairwise or use listwise deletion. The standard deviation calculator ignores blank entries automatically.
What should I check before calculating standard deviation for a dataset with repeated observations?
When values repeat, you can enter each occurrence individually or use a frequency table. Both give the same result. The frequency table standard deviation calculator is more efficient for datasets with many repeated values.
What should I check before calculating standard deviation for a very small sample?
Standard deviation is a measure of how spread out a set of numbers is around their mean. It is the square root of the average squared distance from the mean, expressed in the same units as the original data. A small standard deviation means values cluster close to the mean; a large one means they are widely scattered. See what is standard deviation for a full explanation with examples.
What should I check before calculating standard deviation for a large population?
Standard deviation is a measure of how spread out a set of numbers is around their mean. It is the square root of the average squared distance from the mean, expressed in the same units as the original data. A small standard deviation means values cluster close to the mean; a large one means they are widely scattered. See what is standard deviation for a full explanation with examples.
What should I check before calculating standard deviation for streaming data?
For streaming SD calculation, use Welford's algorithm, which updates incrementally as each new value arrives, avoiding the need to store all values. The large dataset standard deviation calculator uses this method.
What should I check before calculating standard deviation for a list with zero values?
Zero values in a dataset are handled normally: subtract the mean from zero and square. Zeros do not need special treatment. Use the standard deviation calculator with any mix of values.
What should I check before calculating standard deviation for a list with negative values?
Standard deviation handles negative numbers normally: the squaring step makes deviations positive. Enter negative values with the minus sign. Use the standard deviation calculator with any mix of values.
What should I check before calculating standard deviation for a dataset with different measurement units?
If your dataset contains different measurement units, SD is not meaningful: it is expressed in the same units as the data. Convert all values to the same unit, or use the relative standard deviation calculator for a unitless comparison of spread.
What should I check before calculating standard deviation for a dataset containing only one observation?
Standard deviation is a measure of how spread out a set of numbers is around their mean. It is the square root of the average squared distance from the mean, expressed in the same units as the original data. A small standard deviation means values cluster close to the mean; a large one means they are widely scattered. See what is standard deviation for a full explanation with examples.
What should a beginner know about interpreting a standard deviation value?
Standard deviation is used across many fields to measure variability. See standard deviation use cases for domain-specific applications.
What should a college student know about interpreting a standard deviation value?
Standard deviation is used across many fields to measure variability. See standard deviation use cases for domain-specific applications.
What should a researcher know about interpreting a standard deviation value?
Standard deviation is used across many fields to measure variability. See standard deviation use cases for domain-specific applications.
What should a data analyst know about interpreting a standard deviation value?
Standard deviation is used across many fields to measure variability. See standard deviation use cases for domain-specific applications.
What should a teacher preparing a lesson know about interpreting a standard deviation value?
Standard deviation is used across many fields to measure variability. See standard deviation use cases for domain-specific applications.
What should a business analyst know about interpreting a standard deviation value?
Standard deviation is used across many fields to measure variability. See standard deviation use cases for domain-specific applications.
How is standard deviation calculated in exam scores?
Standard deviation is a measure of how spread out a set of numbers is around their mean. It is the square root of the average squared distance from the mean, expressed in the same units as the original data. A small standard deviation means values cluster close to the mean; a large one means they are widely scattered. See what is standard deviation for a full explanation with examples.
What should a beginner know about checking a standard deviation calculation?
Standard deviation is used across many fields to measure variability. See standard deviation use cases for domain-specific applications.
What should a high-school student know about checking a standard deviation calculation?
Standard deviation is used across many fields to measure variability. See standard deviation use cases for domain-specific applications.
What should a college student know about checking a standard deviation calculation?
Standard deviation is used across many fields to measure variability. See standard deviation use cases for domain-specific applications.
What should a researcher know about checking a standard deviation calculation?
Standard deviation is used across many fields to measure variability. See standard deviation use cases for domain-specific applications.
What should a data analyst know about checking a standard deviation calculation?
Standard deviation is used across many fields to measure variability. See standard deviation use cases for domain-specific applications.
What should a teacher preparing a lesson know about checking a standard deviation calculation?
Standard deviation is used across many fields to measure variability. See standard deviation use cases for domain-specific applications.
What should someone preparing for a statistics exam know about checking a standard deviation calculation?
Standard deviation is used across many fields to measure variability. See standard deviation use cases for domain-specific applications.
What should a business analyst know about checking a standard deviation calculation?
Standard deviation is used across many fields to measure variability. See standard deviation use cases for domain-specific applications.
How do I calculate relative standard deviation as a percentage?
Standard deviation is a measure of how spread out a set of numbers is around their mean. It is the square root of the average squared distance from the mean, expressed in the same units as the original data. A small standard deviation means values cluster close to the mean; a large one means they are widely scattered. See what is standard deviation for a full explanation with examples.
What should a beginner know about standard deviation and outliers?
Standard deviation is used across many fields to measure variability. See standard deviation use cases for domain-specific applications.
What should a high-school student know about standard deviation and outliers?
Standard deviation is used across many fields to measure variability. See standard deviation use cases for domain-specific applications.
What should a college student know about standard deviation and outliers?
Standard deviation is used across many fields to measure variability. See standard deviation use cases for domain-specific applications.
What should a researcher know about standard deviation and outliers?
Standard deviation is used across many fields to measure variability. See standard deviation use cases for domain-specific applications.
What should a data analyst know about standard deviation and outliers?
Standard deviation is used across many fields to measure variability. See standard deviation use cases for domain-specific applications.
What should a teacher preparing a lesson know about standard deviation and outliers?
Standard deviation is used across many fields to measure variability. See standard deviation use cases for domain-specific applications.
What should a business analyst know about standard deviation and outliers?
Standard deviation is used across many fields to measure variability. See standard deviation use cases for domain-specific applications.
How do I calculate standard deviation for grouped data in R?
Standard deviation is a measure of how spread out a set of numbers is around their mean. It is the square root of the average squared distance from the mean, expressed in the same units as the original data. A small standard deviation means values cluster close to the mean; a large one means they are widely scattered. See what is standard deviation for a full explanation with examples.
How do I calculate standard deviation for grouped data in Java?
Standard deviation is a measure of how spread out a set of numbers is around their mean. It is the square root of the average squared distance from the mean, expressed in the same units as the original data. A small standard deviation means values cluster close to the mean; a large one means they are widely scattered. See what is standard deviation for a full explanation with examples.
How do I calculate standard deviation for grouped data in C++?
Standard deviation is a measure of how spread out a set of numbers is around their mean. It is the square root of the average squared distance from the mean, expressed in the same units as the original data. A small standard deviation means values cluster close to the mean; a large one means they are widely scattered. See what is standard deviation for a full explanation with examples.
How do I calculate standard deviation for grouped data in SQL?
Standard deviation is a measure of how spread out a set of numbers is around their mean. It is the square root of the average squared distance from the mean, expressed in the same units as the original data. A small standard deviation means values cluster close to the mean; a large one means they are widely scattered. See what is standard deviation for a full explanation with examples.
How do I calculate standard deviation for a table with class midpoints?
Standard deviation is a measure of how spread out a set of numbers is around their mean. It is the square root of the average squared distance from the mean, expressed in the same units as the original data. A small standard deviation means values cluster close to the mean; a large one means they are widely scattered. See what is standard deviation for a full explanation with examples.