Standard deviation in psychology: Definition & APA format
- Definition
- In psychology, standard deviation (SD) is a measure of variability. It shows how far individual scores typically fall from the group's mean. A small SD means scores cluster near the average; a large SD means they are spread out.
- Example
- IQ tests are scaled to a mean of 100 and an SD of 15, so about two-thirds of people score between 85 and 115.
Put more fully, the standard deviation is the measure of variability that describes how far individual scores typically fall from the mean of their group, in the same units as the scores themselves. It sits beside the mean in every results section, underneath every IQ scale, and inside every effect size, so it is worth understanding properly rather than treating it as a number the software emits.
Working with your own data? The standard deviation calculator takes a pasted column of scores and returns M and SD in APA form with every step of the arithmetic shown, or read the formula first if you need to reproduce it by hand.
Why spread is the whole point
In many fields the standard deviation is a nuisance term: noise around the value you actually wanted. Psychology is different. Its subject matter is individual differences: why one person recalls nine words and another four, why anxiety scores on the same questionnaire run from floor to ceiling. The spread of a distribution is not error obscuring the signal; it very often is the signal.
That is why a mean reported on its own is close to useless in a psychology paper. Two groups with a mean reaction time of 420 ms could be a set of practically identical participants, or a mix of very fast and very slow ones whose average happens to land in the middle. The standard deviation is the number that tells those two apart, and reporting it is a matter of convention rather than choice.
Standard deviation example: ten memory-test scores
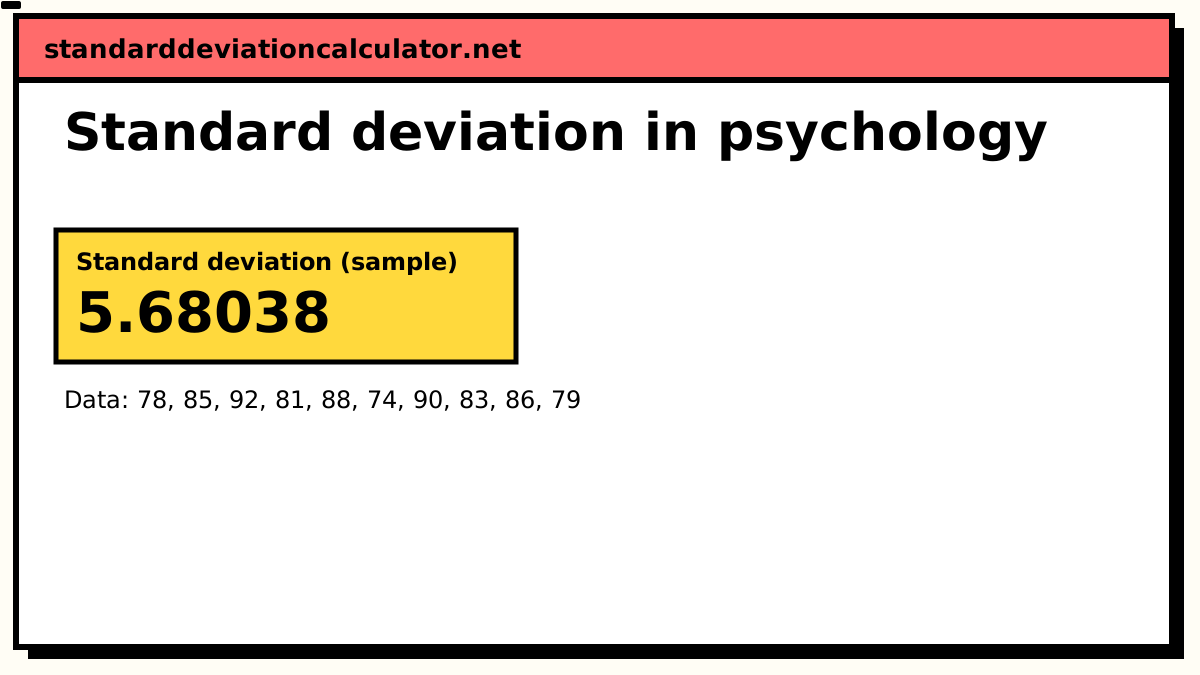
Ten participants sit a 100-point memory test and score 78, 85, 92, 81, 88, 74, 90, 83, 86 and 79. The scores sum to 836, so the mean is 836 ÷ 10 = 83.6. The next step is to see how far each participant sits from that mean, and to square the distance so that scores above and below do not cancel out.
| Participant | Score (x) | x − x̄ | (x − x̄)² |
|---|---|---|---|
| 1 | 78 | −5.6 | 31.36 |
| 2 | 85 | 1.4 | 1.96 |
| 3 | 92 | 8.4 | 70.56 |
| 4 | 81 | −2.6 | 6.76 |
| 5 | 88 | 4.4 | 19.36 |
| 6 | 74 | −9.6 | 92.16 |
| 7 | 90 | 6.4 | 40.96 |
| 8 | 83 | −0.6 | 0.36 |
| 9 | 86 | 2.4 | 5.76 |
| 10 | 79 | −4.6 | 21.16 |
| Sum | 836 | 0 | 290.40 |
The deviations sum to zero, as they always do; that is what the mean is. The squared deviations sum to 290.40. Because these ten people stand in for a wider population, divide by n − 1 = 9 rather than by 10:
s² = 290.40 ÷ 9 = 32.27 s = √32.27 = 5.68
So the sample has a mean of 83.60 and a standard deviation of 5.68 points. Read plainly: a typical participant scored within about six points of the average. The one score that was more than nine points away, participant 6 at 74, contributed nearly a third of the entire sum of squares on its own, which is squaring doing its job of weighting the far-out cases.
Had you divided by 10 instead, you would have got 5.39. That is the population standard deviation, and it is the wrong one here; see sample versus population for the reasoning. The calculator below is loaded with the same ten scores and shows every step.
Separate numbers with commas, spaces or new lines, or paste a spreadsheet column.
Decimals and negatives are fine; write 10:3 for a value that occurs 3 times.
Your results will appear here: the standard deviation first, then the rest of the summary and a chart.
Standard deviation (sample)
5.68038
5.68
Your values typically sit about 5.68 above or below their mean of 83.6, in the same units as your data. 7 of 10 values (70%) fall between 77.92 and 89.28, within one standard deviation of the mean; for normally distributed data about 68% would.
Population SD (σ): 5.38888, if these values are the whole group.
- Count (n)
- 10
- Mean (x̄)
- 83.6
- Variance (s²)
- 32.2667
- Standard error
- 1.79629
- Minimum
- 74
- Q1 (25%)
- 79.5
- Median
- 84
- Q3 (75%)
- 87.5
- Maximum
- 92
- Range
- 18
More statistics (5)
- Relative SD (%RSD)
- 6.79471%
- Coefficient of variation
- 0.0679471
- Sum (Σx)
- 836
- Sum of squares, Σ(x − x̄)²
- 290.4
- IQR (Q3 − Q1)
- 8
Data distribution
Shaded bands mark ±1, ±2 and ±3 SD from the mean. 7 of 10 values (70%) fall within ±1 SD.
Chart as text
Mean 83.6, sample standard deviation s = 5.68038, from 10 values between 74 and 92.
- Within ±1 SD (77.92 to 89.28): 7 of 10 values (70%). About 68% for normal data.
- Within ±2 SD: 10 (100%). About 95% for normal data.
- Within ±3 SD: 10 (100%). About 99.7% for normal data.
Show the working, step by step
Standardised scales built on the standard deviation
Once you know a distribution's mean and standard deviation, any raw score can be rewritten as a distance from the mean in standard-deviation units: a z-score. Participant 3 above, at 92, has z = (92 − 83.6) ÷ 5.68 = 1.48: about one and a half standard deviations above the group mean. Psychological tests go one step further and re-scale those z-scores onto a fixed mean and standard deviation, so that scores from different tests can be compared directly.
| Scale | Mean | SD | Used by |
|---|---|---|---|
| z-score | 0 | 1 | Any standardised variable |
| IQ (deviation IQ) | 100 | 15 | Wechsler scales (WAIS, WISC); current Stanford–Binet |
| T-score | 50 | 10 | MMPI and many personality and clinical inventories |
| Scaled score | 10 | 3 | Wechsler subtests |
| Stanine | 5 | 2 | Educational testing, nine bands |
The IQ scale is the one everyone has met. Wechsler set the mean at 100 and the standard deviation at 15, and most modern tests follow. Earlier Stanford–Binet editions used 16, which is why an old score can be a point or two off a new one for the same underlying ability, and why a cut-off such as "IQ below 70" was never quite the same threshold on every instrument.
On a normal distribution, position in standard deviations translates straight into a percentile. One standard deviation above the mean (an IQ of 115, a T-score of 60) is the 84th percentile. Two above (IQ 130, T-score 70) is roughly the 97.7th percentile, which is what a clinician means when they say a score is "in the top 2–3 per cent". Two below (IQ 70) is just above the 2nd percentile, and one below (IQ 85) is the 16th. The z-score calculator converts any raw score, and the percentile calculator turns the z into a percentile rank. Going the other way, the raw score calculator turns a z-score or percentile back into a score on any of these scales.
Reporting it in APA style
The convention in the seventh edition of the APA Publication Manual is to report the mean and the standard deviation together, with the statistical symbols in italics and a space either side of the equals sign. For the ten scores above:
Participants recalled a mean of 83.60 items (SD = 5.68, n = 10). or Memory scores were high (M = 83.60, SD = 5.68).
Three habits keep this clean. Give two decimal places unless the measurement itself is cruder. Never report a mean without its standard deviation; a reviewer will ask for it. And use the sample standard deviation, dividing by n − 1; that is what SPSS, R and jamovi return by default and what every reader will assume you used.
When you have more than two or three conditions, the numbers belong in a descriptive statistics table rather than the text. The layout is simple: one row per group or condition, columns for n, M and SD, with the symbols italicised in the headings. Some journals ask for a 95% confidence interval column beside the mean; it does not replace the standard deviation, because the two answer different questions.
| Condition | n | M | SD |
|---|---|---|---|
| Spaced practice | 10 | 83.60 | 5.68 |
| Massed practice | 10 | 77.80 | 4.13 |
Effect size: Cohen's d
A t-test tells you whether two means differ by more than chance would explain. It does not tell you whether the difference is large enough to care about, and with a big enough sample almost any difference clears the significance bar. Psychology's answer is Cohen's d: the difference between the means divided by the pooled standard deviation, so the gap is expressed in standard-deviation units rather than raw points.
d = (M₁ − M₂) ÷ spooled spooled = √[ ((n₁ − 1)s₁² + (n₂ − 1)s₂²) ÷ (n₁ + n₂ − 2) ]
Take the two conditions in the table. The spaced group has M = 83.60, SD = 5.68; the massed group, with scores of 76, 80, 71, 84, 79, 73, 82, 77, 75 and 81, has M = 77.80, SD = 4.13. With ten in each group the pooled variance is simply the average of the two variances:
spooled = √[ (9 × 32.27 + 9 × 17.07) ÷ 18 ] = √24.67 = 4.97 d = (83.60 − 77.80) ÷ 4.97 = 5.80 ÷ 4.97 = 1.17
The spaced group scored about 1.2 standard deviations higher than the massed group. Cohen (1988) offered 0.2, 0.5 and 0.8 as rough labels for small, medium and large effects, and those benchmarks are quoted in nearly every methods course. He also warned, in the same book, that they were arbitrary conventions to fall back on when a field had no better basis for judgement, and that a "small" effect in one literature can be a striking one in another. Report the number and let the reader judge it against the field, rather than the label alone.
The pooled SD calculator handles unequal group sizes, where the weighting matters, and the t-test calculator reports d alongside the test itself. For Hedges' g, Glass's Δ, or converting between d and r, use the effect size calculator.
Standard deviation versus standard error
This is the confusion that costs the most marks. The standard deviation describes the participants: how widely their scores are spread. The standard error of the mean describes the estimate: how far the sample mean is likely to sit from the population mean. It equals the standard deviation divided by √n, so for the spaced group it is 5.68 ÷ √10 = 1.80.
Both are legitimate to report, but they are not interchangeable, and the standard error is always the smaller number. Error bars drawn from it look tight and persuasive; error bars drawn from the standard deviation look wide and honest about individual variation. A figure caption should always say which one it shows. If the point of the figure is to compare group means, the standard error or a confidence interval is the right choice; if the point is to show how variable people are, use the standard deviation. The standard error calculator gives both from the same data.
When the standard deviation is the wrong summary
The standard deviation assumes the mean is a sensible centre, and in three common psychological datasets it is not.
Reaction times are almost always skewed to the right: there is a hard floor of a couple of hundred milliseconds below which nobody can respond, but no ceiling on how long a lapse of attention can take. A handful of slow trials pulls the mean up and inflates the standard deviation far more than they shift the typical response. Reaction-time researchers routinely trim or transform the data before computing a mean and standard deviation, or report the median instead.
Single Likert items are ordinal (the distance from "agree" to "strongly agree" is not known to equal the distance from "neutral" to "agree"), so a mean and standard deviation on a single five-point item are of doubtful meaning. Summed scales of many items behave closely enough to interval data that the convention is to treat them as such, and reporting M and SD for a scale total is standard practice.
Very small samples give a standard deviation that is itself extremely uncertain. With five participants, one unusual score can double it. That does not make it wrong to report, but it does make it wrong to lean on.
In each case the median and the interquartile range are the robust alternatives, since neither is moved by a few extreme values. The IQR calculator reports both and flags outliers by the usual 1.5 × IQR rule, which is the first thing to run on a reaction-time column before deciding how to summarise it.
Where to go next
Everything above rests on one calculation, and it is worth being able to do it rather than only read it. The standard deviation formula takes the arithmetic apart term by term and explains why psychology's n − 1 denominator is almost always the right one; the sample versus population distinction matters more here than in most fields, because a sample of participants is never the population you are generalising to.
For the conceptual side, what standard deviation actually measures covers how to read a value once you have one, and standard deviation versus variance explains why results sections report SD while ANOVA tables report variance: the same quantity, one of them square-rooted.
Distributions in psychology are usually drawn rather than tabulated, and the standard deviation graph plots a set of scores with the ±1, ±2 and ±3 SD bands shaded, which is the quickest way to see whether a score distribution is anywhere near normal before you apply the 68–95–99.7 rule to it.
Related calculators
-
Standard deviation calculator
Paste your scores and get M and SD with the working shown.
-
Z-score calculator
Convert a raw score to standard deviations from the mean.
-
Pooled SD calculator
The denominator for Cohen’s d from two groups.
-
T-test calculator
Compare two group means, with the effect size alongside.
-
The formula explained
Every term in s = √[Σ(x − x̄)²/(n − 1)], and why n − 1 is right for participants.
-
Standard deviation graph
Plot a score distribution with the SD bands shaded over it.
Common questions
What is the definition of standard deviation in psychology?
Standard deviation is a measure of variability. It shows how far individual scores typically fall from the group's mean, in the same units as the scores. A small standard deviation means participants scored similarly; a large one means they were spread widely around the average.
Why do psychologists use standard deviation?
Because individual differences are the subject matter. Two groups can share a mean and still describe completely different populations of people, and the standard deviation is the number that separates them. It is also the building block for z-scores, standardised test scales such as IQ, effect sizes such as Cohen's d, and every t-test and ANOVA.
How do you report standard deviation in APA style?
Report it alongside the mean, with both symbols in italics: M = 83.60, SD = 5.68. Round to two decimal places, put a space either side of the equals sign, and give the sample size once, as n = 10. In a table, the column headings are simply M and SD.
What does the standard deviation of IQ mean?
Modern IQ tests are scaled so the mean is 100 and the standard deviation is 15. An IQ of 115 is one standard deviation above the mean, around the 84th percentile; 130 is two above, around the 98th; 70 is two below, around the 2nd. Some older tests, including earlier Stanford–Binet editions, used a standard deviation of 16, so the same raw ability translates to a slightly different number.
What is the difference between standard deviation and standard error in psychology?
The standard deviation describes how spread out the participants' scores are. The standard error describes how precisely the sample mean estimates the population mean, and equals the standard deviation divided by the square root of n. It is always the smaller of the two, which is why error bars drawn from it look tighter. A paper should say which one its error bars show.
How do you calculate standard deviation in psychology?
Find the mean, subtract it from every score, square each difference, add the squares up, divide by n − 1 and take the square root. Psychology almost always uses the n − 1 version because the participants are a sample standing in for a wider population. The worked example on this page walks through every step, and the calculator shows the same steps for your own data.
What is an example of standard deviation in psychology?
A classic example is reaction-time research. If 100 participants complete a Stroop task and the mean response time is 750 ms with a standard deviation of 120 ms, most participants responded between 630 and 870 ms (one SD from the mean). A second group with the same mean but SD = 300 ms responded far less consistently, suggesting something other than the experimental manipulation is affecting performance.
What is a good standard deviation in psychology?
There is no universal "good" SD in psychology because the meaningful range depends on the measure. For IQ, an SD of 15 is built into the test design. For a five-point Likert scale, an SD above 2.0 suggests participants used the full range; below 0.5 suggests they clustered tightly. The standard deviation is not good or bad on its own; it is useful when compared to the mean (the coefficient of variation) or when two groups are compared on the same measure.
How do you interpret standard deviation in a psychology study?
First, check the mean and the SD together. A mean of 50 with SD = 5 suggests a tight cluster; the same mean with SD = 20 suggests a spread-out group where the mean is less representative. Second, compare groups: if Treatment A (M = 12.4, SD = 1.2) and Treatment B (M = 14.1, SD = 3.8) both improve scores, Treatment A is more consistent. Third, use the SD to compute z-scores for individual participants, which is how standardised tests and clinical cutoffs are built.
Frequently asked questions about standard deviation in psychology
Common questions
How is standard deviation calculated in psychology?
In psychology, SD measures individual differences. It is the foundation of z-scores, standardised tests (IQ uses SD = 15), effect sizes (Cohen's d), and all parametric tests. Results are reported as M ± SD. See standard deviation in psychology for a full treatment with APA-style reporting.
Why is standard deviation useful for psychology?
Standard deviation is a measure of how spread out a set of numbers is around their mean. It is the square root of the average squared distance from the mean, expressed in the same units as the original data. A small standard deviation means values cluster close to the mean; a large one means they are widely scattered. See what is standard deviation for a full explanation with examples.
How should I interpret a high standard deviation in psychology?
In psychology, standard deviation measures how much individual scores vary from the group mean. It is the foundation of z-scores, standardised test scales, effect sizes and all parametric tests. A small SD means consistent responses; a large SD means diverse responses. Results are reported as M ± SD. See standard deviation in psychology for full treatment.
How should I interpret a low standard deviation in psychology?
In psychology, standard deviation measures how much individual scores vary from the group mean. It is the foundation of z-scores, standardised test scales, effect sizes and all parametric tests. A small SD means consistent responses; a large SD means diverse responses. Results are reported as M ± SD. See standard deviation in psychology for full treatment.
Can standard deviation compare two datasets in psychology?
In psychology, SD measures individual differences. It is the foundation of z-scores, standardised tests (IQ uses SD = 15), effect sizes (Cohen's d), and all parametric tests. Results are reported as M ± SD. See standard deviation in psychology for a full treatment with APA-style reporting.
What are the limitations of standard deviation in psychology?
In psychology, SD measures individual differences. It is the foundation of z-scores, standardised tests (IQ uses SD = 15), effect sizes (Cohen's d), and all parametric tests. Results are reported as M ± SD. See standard deviation in psychology for a full treatment with APA-style reporting.
How is standard deviation explained in psychology?
In psychology, SD measures individual differences. It is the foundation of z-scores, standardised tests (IQ uses SD = 15), effect sizes (Cohen's d), and all parametric tests. Results are reported as M ± SD. See standard deviation in psychology for a full treatment with APA-style reporting.
What does standard deviation mean in psychology?
In psychology, standard deviation measures how much individual scores vary from the group mean. It quantifies individual differences, which are central to psychological research. SD is used for z-scores, standardised test scales (IQ uses SD = 15), effect sizes (Cohen's d), and all parametric tests. Results are reported as M ± SD. See standard deviation in psychology for a complete treatment.
Can you show a standard deviation example from psychology?
Standard deviation is a measure of how spread out a set of numbers is around their mean. It is the square root of the average squared distance from the mean, expressed in the same units as the original data. A small standard deviation means values cluster close to the mean; a large one means they are widely scattered. See what is standard deviation for a full explanation with examples.