What is standard deviation?
Standard deviation is a number that tells you how spread out a set of values is, expressed as the typical distance between a value and the average. A small standard deviation means the values cluster tightly around the mean; a large one means they are scattered widely from it.
Standard deviation: the definition
Formally, the standard deviation is the root mean square deviation from the mean: take how far each value sits from the mean, square those distances, average the squares, and take the square root of the result. Written out, for a whole population of N values with mean μ:
σ = √[ Σ(x − μ)² / N ]
The formula page takes that expression apart term by term. For understanding what the number means, the plain-English version is enough: it is a measure of how far, on average, the data strays from its centre. Statisticians call this a measure of dispersion or spread, and it is the most widely used one there is.
Try it below. The calculator computes the standard deviation of whatever you enter and lays out each step, so you can watch the definition turn into a number.
Separate numbers with commas, spaces or new lines, or paste a spreadsheet column.
Decimals and negatives are fine; write 10:3 for a value that occurs 3 times.
Your results will appear here: the standard deviation first, then the rest of the summary and a chart.
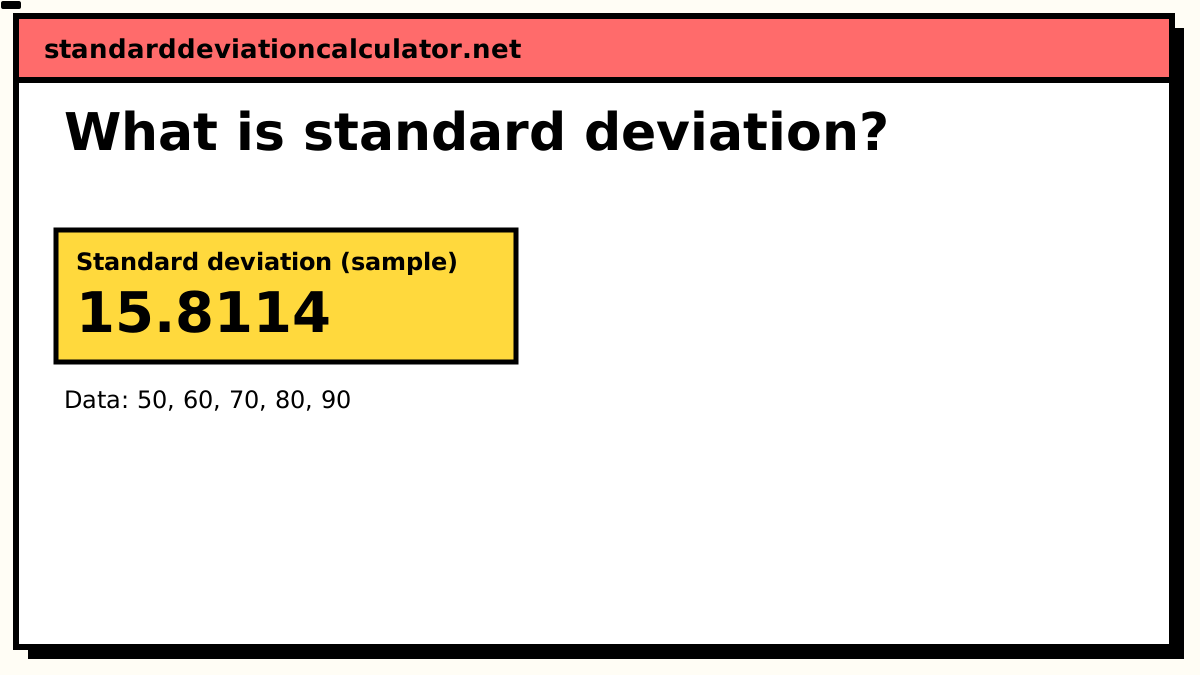
Standard deviation (sample)
15.8114
15.81
Your values typically sit about 15.8 above or below their mean of 70, in the same units as your data. 3 of 5 values (60%) fall between 54.19 and 85.81, within one standard deviation of the mean; for normally distributed data about 68% would.
Population SD (σ): 14.1421, if these values are the whole group.
- Count (n)
- 5
- Mean (x̄)
- 70
- Variance (s²)
- 250
- Standard error
- 7.07107
- Minimum
- 50
- Q1 (25%)
- 60
- Median
- 70
- Q3 (75%)
- 80
- Maximum
- 90
- Range
- 40
More statistics (5)
- Relative SD (%RSD)
- 22.5877%
- Coefficient of variation
- 0.225877
- Sum (Σx)
- 350
- Sum of squares, Σ(x − x̄)²
- 1000
- IQR (Q3 − Q1)
- 20
Data distribution
Shaded bands mark ±1, ±2 and ±3 SD from the mean. 3 of 5 values (60%) fall within ±1 SD.
Chart as text
Mean 70, sample standard deviation s = 15.8114, from 5 values between 50 and 90.
- Within ±1 SD (54.19 to 85.81): 3 of 5 values (60%). About 68% for normal data.
- Within ±2 SD: 5 (100%). About 95% for normal data.
- Within ±3 SD: 5 (100%). About 99.7% for normal data.
Show the working, step by step
What standard deviation measures, and what it does not
Standard deviation measures spread, not location. Two datasets can have the same mean and completely different standard deviations, and two datasets can have identical standard deviations while their means are miles apart. The mean tells you where the data is centred; the standard deviation tells you how tightly it gathers around that centre. Neither one substitutes for the other, which is why results are conventionally reported as a pair, "mean ± SD". Standard deviation vs mean takes the pair apart, including when an SD larger than the mean is a warning sign.
It is also not the range. The range is the gap between the largest and smallest value, and it depends on exactly two observations. The standard deviation uses every value, so a single extreme point stretches it far less than it stretches the range, though it still moves it more than a resistant measure such as the interquartile range would. Nor is it the average distance from the mean in the literal sense. That statistic exists and is called the mean absolute deviation; the standard deviation squares the distances first, which gives large deviations extra weight and is why it is never smaller than the MAD on the same data.
Units: standard deviation is in the same units as the data
If your data is in centimetres, the standard deviation is in centimetres. If it is in seconds, dollars or milligrams, so is the standard deviation. This is the reason the formula ends with a square root. The step before it, the variance, is an average of squared deviations, so its unit is the data's unit squared. A set of adult heights with a mean of 170 cm and a variance of 64 cm² is awkward to interpret, because nobody thinks in square centimetres. Take the square root and you get a standard deviation of 8 cm, which reads naturally: a typical person in the set is about 8 cm from the average height.
Having the same unit as the data is what makes the standard deviation directly comparable to the mean, and what makes statements like "two standard deviations above the mean" translate immediately into a real quantity. It is the practical reason standard deviation, rather than variance, is the number that gets reported.
High vs low standard deviation: two datasets with the same mean
Here are two sets of five test scores. Both have a mean of exactly 70.
- Set A:
68, 69, 70, 71, 72 - Set B:
50, 60, 70, 80, 90
The mean is no help in telling them apart. The standard deviation is. Working set B through the definition, using the sample formula (divide by n − 1) that the calculator above defaults to:
| x | x − x̄ | (x − x̄)² |
|---|---|---|
| 50 | −20 | 400 |
| 60 | −10 | 100 |
| 70 | 0 | 0 |
| 80 | 10 | 100 |
| 90 | 20 | 400 |
| Sum | 0 | 1000 |
s² = 1000 / (5 − 1) = 250 s = √250 = 15.81
Set A goes through the same steps with deviations of −2, −1, 0, 1 and 2. Their squares sum to 10, so s² = 10 / 4 = 2.5 and s = √2.5 = 1.58. Same mean, but one set has a standard deviation ten times the other. A typical score in set A is about a point and a half from average; a typical score in set B is nearly sixteen points from it. Notice also that the middle column sums to zero in both cases. It always does, which is the reason the deviations have to be squared before they are averaged.
Drawn as curves, the difference is immediate: the low-SD set makes a tall, narrow peak and the high-SD set a low, wide one. You can see small and large standard deviations drawn side by side, or plot your own data with its SD bands.
So which is "high" and which is "low"? Only relative to each other, and to the mean. There is no universal cut-off. A standard deviation of 15.81 is large for scores that average 70, but it would be tiny for annual salaries that average 70,000. The way to judge a standard deviation is to set it against the mean of the same data, which is what the coefficient of variation does by dividing one by the other, or to compare it with the standard deviation of something similar. If you already have a result to judge, the step-by-step guide to interpreting a standard deviation walks through those checks on a real example.
A standard deviation of zero, and why it can never be negative
A standard deviation of zero means every value is the same. If the data is
7, 7, 7, 7, the mean is 7, every deviation is 0, the sum of squares is 0, and so
is its square root. There is no other way to reach zero: the moment any single value differs
from the rest, at least one deviation is non-zero, its square is positive, and the standard
deviation is positive too.
That is also why the standard deviation can never be negative. Squaring makes every term in the sum non-negative, an average of non-negative numbers is non-negative, and the square root is taken as the positive root by definition. The smallest possible standard deviation is zero. If you ever calculate a negative one, the arithmetic went wrong somewhere, most often by squaring the sum of the deviations instead of summing the squares.
Reading it with the 68–95–99.7 rule
For data that is roughly bell-shaped, the standard deviation has a very concrete meaning. About 68% of the values fall within one standard deviation of the mean, about 95% within two, and about 99.7% within three. This is the empirical rule, and it is the fastest way to turn a standard deviation into a picture of the data.
Adult IQ scores are the textbook case: the tests are scaled to a mean of 100 and a standard deviation of 15, so roughly 68% of people score between 85 and 115, and roughly 95% between 70 and 130. A score of 145 sits three standard deviations above the mean, which puts it in about the top 0.15% of the distribution. The z-score generalises this: it expresses any value as a number of standard deviations from the mean, which is what makes results from different scales comparable.
The caveat matters. The rule describes the normal distribution and holds only approximately for data that resembles one. Skewed data, such as incomes or reaction times, and data with heavy tails will put far more than 5% of values beyond two standard deviations. The standard deviation is still a valid measure of spread for that data; it just no longer maps onto those particular percentages. The exact percentages, why σ sets the width of the bell, and how to check your own data are in standard deviation and the normal distribution.
Sample and population standard deviation
There are two versions of the calculation. The population standard deviation, written σ, divides the sum of squared deviations by N and describes a complete set of values. The sample standard deviation, written s, divides by n − 1 and estimates the spread of a larger group from the subset in front of you. Dividing by the smaller number makes s a little larger than σ would be on the same data, and that inflation exactly corrects the tendency of a sample to look less spread out than the population it came from.
Which one you want depends on your question rather than on your data. If the numbers are everything you care about, use the population version; if they stand in for something bigger, use the sample version, which is the more common situation. The sample vs population page works through the decision and shows how much difference it makes at each sample size. The notation page covers the symbols.
Where standard deviation is used
Laboratory precision. When an analyst measures the same sample repeatedly, the standard deviation of the results is the precision of the method. It is usually reported as the relative standard deviation, the SD as a percentage of the mean, so that methods working at different concentrations can be compared. Five replicates averaging 5.00 mg with an SD of 0.05 mg have an RSD of 1%.
Finance. The standard deviation of an asset's returns is its volatility. A fund whose monthly returns have a high standard deviation swings more widely around its average than one with a low standard deviation, even if the two average the same. Risk in portfolio theory is defined by this number.
Psychology and education. Standardised tests are built around a fixed mean and standard deviation, IQ at 100 and 15 being the best-known example, so that a score can be read as a position in the population rather than a raw count of correct answers. The guide to how psychologists use it covers APA reporting and effect sizes as well.
Manufacturing. Quality control tracks the standard deviation of a measured dimension across production. Control limits are conventionally placed three standard deviations either side of the target, and a process whose spread is small relative to its tolerance is called capable. "Six sigma" takes its name from the standard deviation symbol.
Common misconceptions
- "A high standard deviation is bad." It is neither good nor bad; it is a description. High variability in manufacturing tolerances is a problem. High variability in a set of exam scores may be exactly what a well-designed exam is supposed to produce.
- "Standard deviation tells you the shape of the data." It does not. Two datasets can share a mean and a standard deviation while one is symmetric and the other is badly skewed. The 68–95–99.7 percentages assume a shape; the standard deviation itself makes no such assumption.
- "It is the average distance from the mean." Close, but that describes the mean absolute deviation. Because standard deviation squares the distances first, it is pulled more by the far-out values and is always at least as large as the MAD.
- "Standard deviation and standard error are the same thing." The standard deviation describes the spread of the data. The standard error describes the uncertainty in the mean, and shrinks as you collect more data. The standard deviation does not.
- "Outliers barely affect it." They affect it a great deal. Because the deviations are squared, one value far from the mean can dominate the sum. Check for outliers before trusting a standard deviation on a small dataset, and consider the interquartile range if they are genuine.
When you are ready to compute one by hand, the step-by-step guide walks through the arithmetic, and the methodology page explains exactly how the calculators on this site do it.
Related calculators
-
Standard deviation calculator
Compute it for your own data, with every step of the working shown.
-
The formula explained
Each term of the sample and population formulas, and why they are there.
-
Empirical rule calculator
The 68–95–99.7 bands for any mean and standard deviation.
-
Z-score calculator
How many standard deviations a single value sits from the mean.
-
The symbols in the formula
What xᵢ, x̄, n, Σ and s mean, with one worked example.
Common questions
What does standard deviation mean in simple terms?
It is the typical distance between a value and the average of the dataset. A small standard deviation means the values are bunched tightly around the mean; a large one means they are scattered widely. It answers the question "how far from average is a normal observation?"
What is the unit of standard deviation?
The same unit as the data. If you measured heights in centimetres, the standard deviation is in centimetres; if you measured times in seconds, it is in seconds. That is what the square root in the formula is for: the variance is in squared units, and the root brings it back to the original scale.
What does a standard deviation of zero mean?
Every value in the dataset is identical. If all the values equal the mean, every deviation is zero, so the sum of squared deviations is zero and the square root of that is zero. It is the only way to get a standard deviation of exactly zero, and it means there is no spread at all.
Can standard deviation be negative?
No. Each deviation is squared before being averaged, so the average is a sum of non-negative numbers, and the standard deviation is defined as the positive square root of that. The smallest possible value is zero. If a calculation gives a negative result, there is an error in the arithmetic.
What counts as a high or low standard deviation?
There is no fixed threshold. The number only makes sense relative to the mean and the context: an SD of 5 is enormous for adult shoe sizes and negligible for household incomes. Compare it with the mean (the coefficient of variation does this directly) or with the SD of a comparable dataset.
What is the difference between standard deviation and variance?
The standard deviation is the square root of the variance. Variance is the average squared deviation from the mean, so it is in squared units and hard to read directly; taking the square root returns it to the units of the data. The two carry exactly the same information, but standard deviation is the one you report and interpret.
What is ddof in standard deviation?
ddof ("delta degrees of freedom") is the NumPy and pandas setting for the divisor, which is N − ddof. ddof=0 gives the population standard deviation and ddof=1 the sample one. NumPy defaults to 0 and pandas to 1.
What do SD, sdev and stdev mean?
All three are abbreviations of standard deviation. SD is usual in papers, stdev in spreadsheets, and sdev or std in software output.
Questions about what standard deviation is
Common questions
What does an error message in a standard deviation calculator mean?
Standard deviation is a measure of how spread out a set of numbers is around their mean. It is the square root of the average squared distance from the mean, expressed in the same units as the original data. A small standard deviation means values cluster close to the mean; a large one means they are widely scattered. See what is standard deviation for a full explanation with examples.
What is standard deviation?
Standard deviation is a measure of how spread out a set of numbers is around their mean. It is the square root of the average squared distance from the mean, expressed in the same units as the original data. A small standard deviation means values cluster close to the mean; a large one means they are widely scattered. See what is standard deviation for a full explanation with examples.
Why is standard deviation important?
Standard deviation is a measure of how spread out a set of numbers is around their mean. It is the square root of the average squared distance from the mean, expressed in the same units as the original data. A small standard deviation means values cluster close to the mean; a large one means they are widely scattered. See what is standard deviation for a full explanation with examples.
What is the relationship between standard deviation and spread?
Standard deviation is a measure of how spread out a set of numbers is around their mean. It is the square root of the average squared distance from the mean, expressed in the same units as the original data. A small standard deviation means values cluster close to the mean; a large one means they are widely scattered. See what is standard deviation for a full explanation with examples.
Why is standard deviation useful for education?
Standard deviation is a measure of how spread out a set of numbers is around their mean. It is the square root of the average squared distance from the mean, expressed in the same units as the original data. A small standard deviation means values cluster close to the mean; a large one means they are widely scattered. See what is standard deviation for a full explanation with examples.
Why is standard deviation useful for biology?
Standard deviation is a measure of how spread out a set of numbers is around their mean. It is the square root of the average squared distance from the mean, expressed in the same units as the original data. A small standard deviation means values cluster close to the mean; a large one means they are widely scattered. See what is standard deviation for a full explanation with examples.
Why is standard deviation useful for physics?
Standard deviation is a measure of how spread out a set of numbers is around their mean. It is the square root of the average squared distance from the mean, expressed in the same units as the original data. A small standard deviation means values cluster close to the mean; a large one means they are widely scattered. See what is standard deviation for a full explanation with examples.
Why is standard deviation useful for economics?
Standard deviation is a measure of how spread out a set of numbers is around their mean. It is the square root of the average squared distance from the mean, expressed in the same units as the original data. A small standard deviation means values cluster close to the mean; a large one means they are widely scattered. See what is standard deviation for a full explanation with examples.
Why is standard deviation useful for finance?
Standard deviation is a measure of how spread out a set of numbers is around their mean. It is the square root of the average squared distance from the mean, expressed in the same units as the original data. A small standard deviation means values cluster close to the mean; a large one means they are widely scattered. See what is standard deviation for a full explanation with examples.
Why is standard deviation useful for stock returns?
Standard deviation is a measure of how spread out a set of numbers is around their mean. It is the square root of the average squared distance from the mean, expressed in the same units as the original data. A small standard deviation means values cluster close to the mean; a large one means they are widely scattered. See what is standard deviation for a full explanation with examples.
Can standard deviation compare two datasets in stock returns?
Standard deviation is a measure of how spread out a set of numbers is around their mean. It is the square root of the average squared distance from the mean, expressed in the same units as the original data. A small standard deviation means values cluster close to the mean; a large one means they are widely scattered. See what is standard deviation for a full explanation with examples.
What are the limitations of standard deviation in stock returns?
Standard deviation is a measure of how spread out a set of numbers is around their mean. It is the square root of the average squared distance from the mean, expressed in the same units as the original data. A small standard deviation means values cluster close to the mean; a large one means they are widely scattered. See what is standard deviation for a full explanation with examples.
Why is standard deviation useful for business analytics?
Standard deviation is a measure of how spread out a set of numbers is around their mean. It is the square root of the average squared distance from the mean, expressed in the same units as the original data. A small standard deviation means values cluster close to the mean; a large one means they are widely scattered. See what is standard deviation for a full explanation with examples.
Why is standard deviation useful for manufacturing?
Standard deviation is a measure of how spread out a set of numbers is around their mean. It is the square root of the average squared distance from the mean, expressed in the same units as the original data. A small standard deviation means values cluster close to the mean; a large one means they are widely scattered. See what is standard deviation for a full explanation with examples.
Why is standard deviation useful for quality control?
Standard deviation is a measure of how spread out a set of numbers is around their mean. It is the square root of the average squared distance from the mean, expressed in the same units as the original data. A small standard deviation means values cluster close to the mean; a large one means they are widely scattered. See what is standard deviation for a full explanation with examples.
Why is standard deviation useful for health research?
Standard deviation is a measure of how spread out a set of numbers is around their mean. It is the square root of the average squared distance from the mean, expressed in the same units as the original data. A small standard deviation means values cluster close to the mean; a large one means they are widely scattered. See what is standard deviation for a full explanation with examples.
Why is standard deviation useful for sports performance?
Standard deviation is a measure of how spread out a set of numbers is around their mean. It is the square root of the average squared distance from the mean, expressed in the same units as the original data. A small standard deviation means values cluster close to the mean; a large one means they are widely scattered. See what is standard deviation for a full explanation with examples.
Why is standard deviation useful for weather data?
Standard deviation is a measure of how spread out a set of numbers is around their mean. It is the square root of the average squared distance from the mean, expressed in the same units as the original data. A small standard deviation means values cluster close to the mean; a large one means they are widely scattered. See what is standard deviation for a full explanation with examples.
Why is standard deviation useful for agriculture?
Standard deviation is a measure of how spread out a set of numbers is around their mean. It is the square root of the average squared distance from the mean, expressed in the same units as the original data. A small standard deviation means values cluster close to the mean; a large one means they are widely scattered. See what is standard deviation for a full explanation with examples.
Why is standard deviation useful for machine learning?
Standard deviation is a measure of how spread out a set of numbers is around their mean. It is the square root of the average squared distance from the mean, expressed in the same units as the original data. A small standard deviation means values cluster close to the mean; a large one means they are widely scattered. See what is standard deviation for a full explanation with examples.
Why is standard deviation useful for data science?
Standard deviation is a measure of how spread out a set of numbers is around their mean. It is the square root of the average squared distance from the mean, expressed in the same units as the original data. A small standard deviation means values cluster close to the mean; a large one means they are widely scattered. See what is standard deviation for a full explanation with examples.
Why is standard deviation useful for clinical trials?
Standard deviation is a measure of how spread out a set of numbers is around their mean. It is the square root of the average squared distance from the mean, expressed in the same units as the original data. A small standard deviation means values cluster close to the mean; a large one means they are widely scattered. See what is standard deviation for a full explanation with examples.
Why is standard deviation useful for survey results?
Standard deviation is a measure of how spread out a set of numbers is around their mean. It is the square root of the average squared distance from the mean, expressed in the same units as the original data. A small standard deviation means values cluster close to the mean; a large one means they are widely scattered. See what is standard deviation for a full explanation with examples.
Why is standard deviation useful for customer satisfaction?
Standard deviation is a measure of how spread out a set of numbers is around their mean. It is the square root of the average squared distance from the mean, expressed in the same units as the original data. A small standard deviation means values cluster close to the mean; a large one means they are widely scattered. See what is standard deviation for a full explanation with examples.
Why is standard deviation useful for daily temperatures?
Standard deviation is a measure of how spread out a set of numbers is around their mean. It is the square root of the average squared distance from the mean, expressed in the same units as the original data. A small standard deviation means values cluster close to the mean; a large one means they are widely scattered. See what is standard deviation for a full explanation with examples.
Why is standard deviation useful for sales data?
Standard deviation is a measure of how spread out a set of numbers is around their mean. It is the square root of the average squared distance from the mean, expressed in the same units as the original data. A small standard deviation means values cluster close to the mean; a large one means they are widely scattered. See what is standard deviation for a full explanation with examples.
Why is standard deviation useful for investment risk?
Standard deviation is a measure of how spread out a set of numbers is around their mean. It is the square root of the average squared distance from the mean, expressed in the same units as the original data. A small standard deviation means values cluster close to the mean; a large one means they are widely scattered. See what is standard deviation for a full explanation with examples.
Can standard deviation compare two datasets in investment risk?
In finance, SD is the standard measure of volatility. A high SD means volatile returns (higher risk). The Sharpe ratio divides excess return by SD. Portfolio SD depends on individual asset SDs and their correlations. See standard deviation in finance.
What are the limitations of standard deviation in investment risk?
In finance, SD is the standard measure of volatility. A high SD means volatile returns (higher risk). The Sharpe ratio divides excess return by SD. Portfolio SD depends on individual asset SDs and their correlations. See standard deviation in finance.
Why is standard deviation useful for process capability?
Standard deviation is a measure of how spread out a set of numbers is around their mean. It is the square root of the average squared distance from the mean, expressed in the same units as the original data. A small standard deviation means values cluster close to the mean; a large one means they are widely scattered. See what is standard deviation for a full explanation with examples.
Can standard deviation compare two datasets in process capability?
In quality control, SD measures process consistency. Six Sigma targets no more than 3.4 defects per million by keeping variation within six SDs of the mean. See Cpk and the process capability calculators for quality scoring.
What are the limitations of standard deviation in process capability?
In quality control, SD measures process consistency. Six Sigma targets no more than 3.4 defects per million by keeping variation within six SDs of the mean. See Cpk and the process capability calculators for quality scoring.
Why is standard deviation useful for laboratory measurements?
Standard deviation is a measure of how spread out a set of numbers is around their mean. It is the square root of the average squared distance from the mean, expressed in the same units as the original data. A small standard deviation means values cluster close to the mean; a large one means they are widely scattered. See what is standard deviation for a full explanation with examples.
Can standard deviation compare two datasets in laboratory measurements?
In biology, SD measures variation in measurements such as cell size, enzyme activity, or population traits. Error bars on graphs typically show ±1 SD. A small SD indicates consistent measurements. See standard deviation use cases for more.
What are the limitations of standard deviation in laboratory measurements?
In biology, SD measures variation in measurements such as cell size, enzyme activity, or population traits. Error bars on graphs typically show ±1 SD. A small SD indicates consistent measurements. See standard deviation use cases for more.
What is the difference between standard deviation and range?
Standard deviation is a measure of how spread out a set of numbers is around their mean. It is the square root of the average squared distance from the mean, expressed in the same units as the original data. A small standard deviation means values cluster close to the mean; a large one means they are widely scattered. See what is standard deviation for a full explanation with examples.
What is the difference between standard deviation and interquartile range?
Standard deviation is a measure of how spread out a set of numbers is around their mean. It is the square root of the average squared distance from the mean, expressed in the same units as the original data. A small standard deviation means values cluster close to the mean; a large one means they are widely scattered. See what is standard deviation for a full explanation with examples.
How do I explain standard deviation to a beginner?
Standard deviation is a measure of how spread out a set of numbers is around their mean. It is the square root of the average squared distance from the mean, expressed in the same units as the original data. A small standard deviation means values cluster close to the mean; a large one means they are widely scattered. See what is standard deviation for a full explanation with examples.
What is the difference between standard deviation and margin of error?
Standard deviation is a measure of how spread out a set of numbers is around their mean. It is the square root of the average squared distance from the mean, expressed in the same units as the original data. A small standard deviation means values cluster close to the mean; a large one means they are widely scattered. See what is standard deviation for a full explanation with examples.
What is the difference between standard deviation and root mean square deviation?
Standard deviation is a measure of how spread out a set of numbers is around their mean. It is the square root of the average squared distance from the mean, expressed in the same units as the original data. A small standard deviation means values cluster close to the mean; a large one means they are widely scattered. See what is standard deviation for a full explanation with examples.
What is the fastest way to calculate standard deviation from raw data?
Standard deviation is a measure of how spread out a set of numbers is around their mean. It is the square root of the average squared distance from the mean, expressed in the same units as the original data. A small standard deviation means values cluster close to the mean; a large one means they are widely scattered. See what is standard deviation for a full explanation with examples.
What is the difference between standard deviation and z-score?
Standard deviation is a measure of how spread out a set of numbers is around their mean. It is the square root of the average squared distance from the mean, expressed in the same units as the original data. A small standard deviation means values cluster close to the mean; a large one means they are widely scattered. See what is standard deviation for a full explanation with examples.
What is the difference between standard deviation and mean absolute deviation?
Standard deviation is a measure of how spread out a set of numbers is around their mean. It is the square root of the average squared distance from the mean, expressed in the same units as the original data. A small standard deviation means values cluster close to the mean; a large one means they are widely scattered. See what is standard deviation for a full explanation with examples.
What is the variance of 7, 14, 21, 28, 35?
Standard deviation is a measure of how spread out a set of numbers is around their mean. It is the square root of the average squared distance from the mean, expressed in the same units as the original data. A small standard deviation means values cluster close to the mean; a large one means they are widely scattered. See what is standard deviation for a full explanation with examples.
What is the variance of 10, 12, 13, 15, 20?
Standard deviation is a measure of how spread out a set of numbers is around their mean. It is the square root of the average squared distance from the mean, expressed in the same units as the original data. A small standard deviation means values cluster close to the mean; a large one means they are widely scattered. See what is standard deviation for a full explanation with examples.
What is the mean and standard deviation of 10, 12, 13, 15, 20?
Standard deviation is a measure of how spread out a set of numbers is around their mean. It is the square root of the average squared distance from the mean, expressed in the same units as the original data. A small standard deviation means values cluster close to the mean; a large one means they are widely scattered. See what is standard deviation for a full explanation with examples.
What is a simple standard deviation example for students?
Standard deviation is a measure of how spread out a set of numbers is around their mean. It is the square root of the average squared distance from the mean, expressed in the same units as the original data. A small standard deviation means values cluster close to the mean; a large one means they are widely scattered. See what is standard deviation for a full explanation with examples.
What is the difference between standard deviation and coefficient of variation?
Standard deviation is a measure of how spread out a set of numbers is around their mean. It is the square root of the average squared distance from the mean, expressed in the same units as the original data. A small standard deviation means values cluster close to the mean; a large one means they are widely scattered. See what is standard deviation for a full explanation with examples.
What is the Greek letter sigma used for in standard deviation?
Standard deviation is a measure of how spread out a set of numbers is around their mean. It is the square root of the average squared distance from the mean, expressed in the same units as the original data. A small standard deviation means values cluster close to the mean; a large one means they are widely scattered. See what is standard deviation for a full explanation with examples.
What is the empirical rule in statistics?
Standard deviation is a measure of how spread out a set of numbers is around their mean. It is the square root of the average squared distance from the mean, expressed in the same units as the original data. A small standard deviation means values cluster close to the mean; a large one means they are widely scattered. See what is standard deviation for a full explanation with examples.
What does two standard deviations from the mean mean?
Standard deviation is a measure of how spread out a set of numbers is around their mean. It is the square root of the average squared distance from the mean, expressed in the same units as the original data. A small standard deviation means values cluster close to the mean; a large one means they are widely scattered. See what is standard deviation for a full explanation with examples.
What does three standard deviations from the mean mean?
Standard deviation is a measure of how spread out a set of numbers is around their mean. It is the square root of the average squared distance from the mean, expressed in the same units as the original data. A small standard deviation means values cluster close to the mean; a large one means they are widely scattered. See what is standard deviation for a full explanation with examples.
What does a high standard deviation mean?
Standard deviation is a measure of how spread out a set of numbers is around their mean. It is the square root of the average squared distance from the mean, expressed in the same units as the original data. A small standard deviation means values cluster close to the mean; a large one means they are widely scattered. See what is standard deviation for a full explanation with examples.
What is the difference between sample standard deviation and population standard deviation?
Standard deviation is a measure of how spread out a set of numbers is around their mean. It is the square root of the average squared distance from the mean, expressed in the same units as the original data. A small standard deviation means values cluster close to the mean; a large one means they are widely scattered. See what is standard deviation for a full explanation with examples.
What is the mean and standard deviation of 2, 4, 4, 4, 5, 5, 7, 9?
Standard deviation is a measure of how spread out a set of numbers is around their mean. It is the square root of the average squared distance from the mean, expressed in the same units as the original data. A small standard deviation means values cluster close to the mean; a large one means they are widely scattered. See what is standard deviation for a full explanation with examples.
What is the mean and standard deviation of 3, 5, 7, 9, 11?
Standard deviation is a measure of how spread out a set of numbers is around their mean. It is the square root of the average squared distance from the mean, expressed in the same units as the original data. A small standard deviation means values cluster close to the mean; a large one means they are widely scattered. See what is standard deviation for a full explanation with examples.
What is the mean and standard deviation of 1, 2, 3, 4, 5?
Standard deviation is a measure of how spread out a set of numbers is around their mean. It is the square root of the average squared distance from the mean, expressed in the same units as the original data. A small standard deviation means values cluster close to the mean; a large one means they are widely scattered. See what is standard deviation for a full explanation with examples.
What is the mean and standard deviation of 5, 5, 5, 5, 5?
Standard deviation is a measure of how spread out a set of numbers is around their mean. It is the square root of the average squared distance from the mean, expressed in the same units as the original data. A small standard deviation means values cluster close to the mean; a large one means they are widely scattered. See what is standard deviation for a full explanation with examples.
What is the mean and standard deviation of -5, -2, 0, 2, 5?
Standard deviation is a measure of how spread out a set of numbers is around their mean. It is the square root of the average squared distance from the mean, expressed in the same units as the original data. A small standard deviation means values cluster close to the mean; a large one means they are widely scattered. See what is standard deviation for a full explanation with examples.
What is the mean and standard deviation of 1.2, 1.5, 1.8, 2.1?
Standard deviation is a measure of how spread out a set of numbers is around their mean. It is the square root of the average squared distance from the mean, expressed in the same units as the original data. A small standard deviation means values cluster close to the mean; a large one means they are widely scattered. See what is standard deviation for a full explanation with examples.
What is the mean and standard deviation of 7, 14, 21, 28, 35?
Standard deviation is a measure of how spread out a set of numbers is around their mean. It is the square root of the average squared distance from the mean, expressed in the same units as the original data. A small standard deviation means values cluster close to the mean; a large one means they are widely scattered. See what is standard deviation for a full explanation with examples.
What is the mean and standard deviation of 2, 2, 3, 3, 4, 4?
Standard deviation is a measure of how spread out a set of numbers is around their mean. It is the square root of the average squared distance from the mean, expressed in the same units as the original data. A small standard deviation means values cluster close to the mean; a large one means they are widely scattered. See what is standard deviation for a full explanation with examples.
What is the variance of 42, 45, 47, 50, 56?
Standard deviation is a measure of how spread out a set of numbers is around their mean. It is the square root of the average squared distance from the mean, expressed in the same units as the original data. A small standard deviation means values cluster close to the mean; a large one means they are widely scattered. See what is standard deviation for a full explanation with examples.
What is the mean and standard deviation of 42, 45, 47, 50, 56?
Standard deviation is a measure of how spread out a set of numbers is around their mean. It is the square root of the average squared distance from the mean, expressed in the same units as the original data. A small standard deviation means values cluster close to the mean; a large one means they are widely scattered. See what is standard deviation for a full explanation with examples.
What is the mean and standard deviation of 1.5, 2.3, 2.8, 3.1, 4.7?
Standard deviation is a measure of how spread out a set of numbers is around their mean. It is the square root of the average squared distance from the mean, expressed in the same units as the original data. A small standard deviation means values cluster close to the mean; a large one means they are widely scattered. See what is standard deviation for a full explanation with examples.
What does standard deviation measure?
Standard deviation is a measure of how spread out a set of numbers is around their mean. It is the square root of the average squared distance from the mean, expressed in the same units as the original data. A small standard deviation means values cluster close to the mean; a large one means they are widely scattered. See what is standard deviation for a full explanation with examples.
What does a low standard deviation mean?
Standard deviation is a measure of how spread out a set of numbers is around their mean. It is the square root of the average squared distance from the mean, expressed in the same units as the original data. A small standard deviation means values cluster close to the mean; a large one means they are widely scattered. See what is standard deviation for a full explanation with examples.
What does one standard deviation from the mean mean?
Standard deviation is a measure of how spread out a set of numbers is around their mean. It is the square root of the average squared distance from the mean, expressed in the same units as the original data. A small standard deviation means values cluster close to the mean; a large one means they are widely scattered. See what is standard deviation for a full explanation with examples.
What is the variance of 2, 4, 4, 4, 5, 5, 7, 9?
Standard deviation is a measure of how spread out a set of numbers is around their mean. It is the square root of the average squared distance from the mean, expressed in the same units as the original data. A small standard deviation means values cluster close to the mean; a large one means they are widely scattered. See what is standard deviation for a full explanation with examples.
What is the variance of 3, 5, 7, 9, 11?
Standard deviation is a measure of how spread out a set of numbers is around their mean. It is the square root of the average squared distance from the mean, expressed in the same units as the original data. A small standard deviation means values cluster close to the mean; a large one means they are widely scattered. See what is standard deviation for a full explanation with examples.
What is the variance of 1, 2, 3, 4, 5?
Standard deviation is a measure of how spread out a set of numbers is around their mean. It is the square root of the average squared distance from the mean, expressed in the same units as the original data. A small standard deviation means values cluster close to the mean; a large one means they are widely scattered. See what is standard deviation for a full explanation with examples.
What is the variance of 5, 5, 5, 5, 5?
Standard deviation is a measure of how spread out a set of numbers is around their mean. It is the square root of the average squared distance from the mean, expressed in the same units as the original data. A small standard deviation means values cluster close to the mean; a large one means they are widely scattered. See what is standard deviation for a full explanation with examples.
What is the variance of -5, -2, 0, 2, 5?
Standard deviation is a measure of how spread out a set of numbers is around their mean. It is the square root of the average squared distance from the mean, expressed in the same units as the original data. A small standard deviation means values cluster close to the mean; a large one means they are widely scattered. See what is standard deviation for a full explanation with examples.
What is the variance of 1.2, 1.5, 1.8, 2.1?
Standard deviation is a measure of how spread out a set of numbers is around their mean. It is the square root of the average squared distance from the mean, expressed in the same units as the original data. A small standard deviation means values cluster close to the mean; a large one means they are widely scattered. See what is standard deviation for a full explanation with examples.
What is the variance of 12, 18, 21, 25, 30, 34?
Standard deviation is a measure of how spread out a set of numbers is around their mean. It is the square root of the average squared distance from the mean, expressed in the same units as the original data. A small standard deviation means values cluster close to the mean; a large one means they are widely scattered. See what is standard deviation for a full explanation with examples.
What is the variance of 2, 2, 3, 3, 4, 4?
Standard deviation is a measure of how spread out a set of numbers is around their mean. It is the square root of the average squared distance from the mean, expressed in the same units as the original data. A small standard deviation means values cluster close to the mean; a large one means they are widely scattered. See what is standard deviation for a full explanation with examples.
What is the variance of 1.5, 2.3, 2.8, 3.1, 4.7?
Standard deviation is a measure of how spread out a set of numbers is around their mean. It is the square root of the average squared distance from the mean, expressed in the same units as the original data. A small standard deviation means values cluster close to the mean; a large one means they are widely scattered. See what is standard deviation for a full explanation with examples.
What does standard deviation mean in education?
Standard deviation is a measure of how spread out a set of numbers is around their mean. It is the square root of the average squared distance from the mean, expressed in the same units as the original data. A small standard deviation means values cluster close to the mean; a large one means they are widely scattered. See what is standard deviation for a full explanation with examples.
What does standard deviation mean in exam scores?
Standard deviation is a measure of how spread out a set of numbers is around their mean. It is the square root of the average squared distance from the mean, expressed in the same units as the original data. A small standard deviation means values cluster close to the mean; a large one means they are widely scattered. See what is standard deviation for a full explanation with examples.
What does standard deviation mean in biology?
Standard deviation is a measure of how spread out a set of numbers is around their mean. It is the square root of the average squared distance from the mean, expressed in the same units as the original data. A small standard deviation means values cluster close to the mean; a large one means they are widely scattered. See what is standard deviation for a full explanation with examples.
What does standard deviation mean in chemistry?
Standard deviation is a measure of how spread out a set of numbers is around their mean. It is the square root of the average squared distance from the mean, expressed in the same units as the original data. A small standard deviation means values cluster close to the mean; a large one means they are widely scattered. See what is standard deviation for a full explanation with examples.
What does standard deviation mean in physics?
Standard deviation is a measure of how spread out a set of numbers is around their mean. It is the square root of the average squared distance from the mean, expressed in the same units as the original data. A small standard deviation means values cluster close to the mean; a large one means they are widely scattered. See what is standard deviation for a full explanation with examples.
What does standard deviation mean in economics?
Standard deviation is a measure of how spread out a set of numbers is around their mean. It is the square root of the average squared distance from the mean, expressed in the same units as the original data. A small standard deviation means values cluster close to the mean; a large one means they are widely scattered. See what is standard deviation for a full explanation with examples.
What does standard deviation mean in finance?
Standard deviation is a measure of how spread out a set of numbers is around their mean. It is the square root of the average squared distance from the mean, expressed in the same units as the original data. A small standard deviation means values cluster close to the mean; a large one means they are widely scattered. See what is standard deviation for a full explanation with examples.
What does standard deviation mean in stock returns?
Standard deviation is a measure of how spread out a set of numbers is around their mean. It is the square root of the average squared distance from the mean, expressed in the same units as the original data. A small standard deviation means values cluster close to the mean; a large one means they are widely scattered. See what is standard deviation for a full explanation with examples.
What does standard deviation mean in business analytics?
Standard deviation is a measure of how spread out a set of numbers is around their mean. It is the square root of the average squared distance from the mean, expressed in the same units as the original data. A small standard deviation means values cluster close to the mean; a large one means they are widely scattered. See what is standard deviation for a full explanation with examples.
What does standard deviation mean in manufacturing?
Standard deviation is a measure of how spread out a set of numbers is around their mean. It is the square root of the average squared distance from the mean, expressed in the same units as the original data. A small standard deviation means values cluster close to the mean; a large one means they are widely scattered. See what is standard deviation for a full explanation with examples.
What does standard deviation mean in quality control?
Standard deviation is a measure of how spread out a set of numbers is around their mean. It is the square root of the average squared distance from the mean, expressed in the same units as the original data. A small standard deviation means values cluster close to the mean; a large one means they are widely scattered. See what is standard deviation for a full explanation with examples.
What does standard deviation mean in health research?
Standard deviation is a measure of how spread out a set of numbers is around their mean. It is the square root of the average squared distance from the mean, expressed in the same units as the original data. A small standard deviation means values cluster close to the mean; a large one means they are widely scattered. See what is standard deviation for a full explanation with examples.
What does standard deviation mean in sports performance?
Standard deviation is a measure of how spread out a set of numbers is around their mean. It is the square root of the average squared distance from the mean, expressed in the same units as the original data. A small standard deviation means values cluster close to the mean; a large one means they are widely scattered. See what is standard deviation for a full explanation with examples.
What does standard deviation mean in weather data?
Standard deviation is a measure of how spread out a set of numbers is around their mean. It is the square root of the average squared distance from the mean, expressed in the same units as the original data. A small standard deviation means values cluster close to the mean; a large one means they are widely scattered. See what is standard deviation for a full explanation with examples.
What does standard deviation mean in agriculture?
Standard deviation is a measure of how spread out a set of numbers is around their mean. It is the square root of the average squared distance from the mean, expressed in the same units as the original data. A small standard deviation means values cluster close to the mean; a large one means they are widely scattered. See what is standard deviation for a full explanation with examples.
What does standard deviation mean in machine learning?
Standard deviation is a measure of how spread out a set of numbers is around their mean. It is the square root of the average squared distance from the mean, expressed in the same units as the original data. A small standard deviation means values cluster close to the mean; a large one means they are widely scattered. See what is standard deviation for a full explanation with examples.
What does standard deviation mean in data science?
Standard deviation is a measure of how spread out a set of numbers is around their mean. It is the square root of the average squared distance from the mean, expressed in the same units as the original data. A small standard deviation means values cluster close to the mean; a large one means they are widely scattered. See what is standard deviation for a full explanation with examples.
What does standard deviation mean in clinical trials?
Standard deviation is a measure of how spread out a set of numbers is around their mean. It is the square root of the average squared distance from the mean, expressed in the same units as the original data. A small standard deviation means values cluster close to the mean; a large one means they are widely scattered. See what is standard deviation for a full explanation with examples.
What does standard deviation mean in survey results?
Standard deviation is a measure of how spread out a set of numbers is around their mean. It is the square root of the average squared distance from the mean, expressed in the same units as the original data. A small standard deviation means values cluster close to the mean; a large one means they are widely scattered. See what is standard deviation for a full explanation with examples.
What does standard deviation mean in customer satisfaction?
Standard deviation is a measure of how spread out a set of numbers is around their mean. It is the square root of the average squared distance from the mean, expressed in the same units as the original data. A small standard deviation means values cluster close to the mean; a large one means they are widely scattered. See what is standard deviation for a full explanation with examples.
What does standard deviation mean in daily temperatures?
Standard deviation is a measure of how spread out a set of numbers is around their mean. It is the square root of the average squared distance from the mean, expressed in the same units as the original data. A small standard deviation means values cluster close to the mean; a large one means they are widely scattered. See what is standard deviation for a full explanation with examples.
What does standard deviation mean in sales data?
Standard deviation is a measure of how spread out a set of numbers is around their mean. It is the square root of the average squared distance from the mean, expressed in the same units as the original data. A small standard deviation means values cluster close to the mean; a large one means they are widely scattered. See what is standard deviation for a full explanation with examples.
What does standard deviation mean in investment risk?
Standard deviation is a measure of how spread out a set of numbers is around their mean. It is the square root of the average squared distance from the mean, expressed in the same units as the original data. A small standard deviation means values cluster close to the mean; a large one means they are widely scattered. See what is standard deviation for a full explanation with examples.
What does standard deviation mean in process capability?
Standard deviation is a measure of how spread out a set of numbers is around their mean. It is the square root of the average squared distance from the mean, expressed in the same units as the original data. A small standard deviation means values cluster close to the mean; a large one means they are widely scattered. See what is standard deviation for a full explanation with examples.
What does standard deviation mean in laboratory measurements?
Standard deviation is a measure of how spread out a set of numbers is around their mean. It is the square root of the average squared distance from the mean, expressed in the same units as the original data. A small standard deviation means values cluster close to the mean; a large one means they are widely scattered. See what is standard deviation for a full explanation with examples.
What is the difference between standard deviation and variance?
Standard deviation is a measure of how spread out a set of numbers is around their mean. It is the square root of the average squared distance from the mean, expressed in the same units as the original data. A small standard deviation means values cluster close to the mean; a large one means they are widely scattered. See what is standard deviation for a full explanation with examples.
What is the difference between standard deviation and standard error?
Standard deviation is a measure of how spread out a set of numbers is around their mean. It is the square root of the average squared distance from the mean, expressed in the same units as the original data. A small standard deviation means values cluster close to the mean; a large one means they are widely scattered. See what is standard deviation for a full explanation with examples.
What is the difference between standard deviation and mean?
Standard deviation is a measure of how spread out a set of numbers is around their mean. It is the square root of the average squared distance from the mean, expressed in the same units as the original data. A small standard deviation means values cluster close to the mean; a large one means they are widely scattered. See what is standard deviation for a full explanation with examples.
What is the difference between variance and standard error?
Standard deviation is a measure of how spread out a set of numbers is around their mean. It is the square root of the average squared distance from the mean, expressed in the same units as the original data. A small standard deviation means values cluster close to the mean; a large one means they are widely scattered. See what is standard deviation for a full explanation with examples.
Why is the square root used in standard deviation?
Standard deviation is a measure of how spread out a set of numbers is around their mean. It is the square root of the average squared distance from the mean, expressed in the same units as the original data. A small standard deviation means values cluster close to the mean; a large one means they are widely scattered. See what is standard deviation for a full explanation with examples.
How do I handle blank cells when calculating standard deviation in R?
Standard deviation is a measure of how spread out a set of numbers is around their mean. It is the square root of the average squared distance from the mean, expressed in the same units as the original data. A small standard deviation means values cluster close to the mean; a large one means they are widely scattered. See what is standard deviation for a full explanation with examples.
How do I check standard deviation homework answers?
Standard deviation is a measure of how spread out a set of numbers is around their mean. It is the square root of the average squared distance from the mean, expressed in the same units as the original data. A small standard deviation means values cluster close to the mean; a large one means they are widely scattered. See what is standard deviation for a full explanation with examples.
What are common mistakes when calculating standard deviation?
Standard deviation is a measure of how spread out a set of numbers is around their mean. It is the square root of the average squared distance from the mean, expressed in the same units as the original data. A small standard deviation means values cluster close to the mean; a large one means they are widely scattered. See what is standard deviation for a full explanation with examples.
What is the variance of 100, 100, 101, 99, 100?
Standard deviation is a measure of how spread out a set of numbers is around their mean. It is the square root of the average squared distance from the mean, expressed in the same units as the original data. A small standard deviation means values cluster close to the mean; a large one means they are widely scattered. See what is standard deviation for a full explanation with examples.
What is the mean and standard deviation of 100, 100, 101, 99, 100?
Standard deviation is a measure of how spread out a set of numbers is around their mean. It is the square root of the average squared distance from the mean, expressed in the same units as the original data. A small standard deviation means values cluster close to the mean; a large one means they are widely scattered. See what is standard deviation for a full explanation with examples.
Why is standard deviation useful for exam scores?
Standard deviation is a measure of how spread out a set of numbers is around their mean. It is the square root of the average squared distance from the mean, expressed in the same units as the original data. A small standard deviation means values cluster close to the mean; a large one means they are widely scattered. See what is standard deviation for a full explanation with examples.
Can standard deviation compare two datasets in exam scores?
Standard deviation is a measure of how spread out a set of numbers is around their mean. It is the square root of the average squared distance from the mean, expressed in the same units as the original data. A small standard deviation means values cluster close to the mean; a large one means they are widely scattered. See what is standard deviation for a full explanation with examples.
What are the limitations of standard deviation in exam scores?
Standard deviation is a measure of how spread out a set of numbers is around their mean. It is the square root of the average squared distance from the mean, expressed in the same units as the original data. A small standard deviation means values cluster close to the mean; a large one means they are widely scattered. See what is standard deviation for a full explanation with examples.
Why is standard deviation useful for chemistry?
Standard deviation is a measure of how spread out a set of numbers is around their mean. It is the square root of the average squared distance from the mean, expressed in the same units as the original data. A small standard deviation means values cluster close to the mean; a large one means they are widely scattered. See what is standard deviation for a full explanation with examples.
Which related statistics calculator should I use after standard deviation?
Standard deviation is a measure of how spread out a set of numbers is around their mean. It is the square root of the average squared distance from the mean, expressed in the same units as the original data. A small standard deviation means values cluster close to the mean; a large one means they are widely scattered. See what is standard deviation for a full explanation with examples.
Why do statisticians square deviations?
Standard deviation is a measure of how spread out a set of numbers is around their mean. It is the square root of the average squared distance from the mean, expressed in the same units as the original data. A small standard deviation means values cluster close to the mean; a large one means they are widely scattered. See what is standard deviation for a full explanation with examples.
What is the mean and standard deviation of 12, 18, 21, 25, 30, 34?
Standard deviation is a measure of how spread out a set of numbers is around their mean. It is the square root of the average squared distance from the mean, expressed in the same units as the original data. A small standard deviation means values cluster close to the mean; a large one means they are widely scattered. See what is standard deviation for a full explanation with examples.
What is the variance of 0, 10, 20, 30, 40?
Standard deviation is a measure of how spread out a set of numbers is around their mean. It is the square root of the average squared distance from the mean, expressed in the same units as the original data. A small standard deviation means values cluster close to the mean; a large one means they are widely scattered. See what is standard deviation for a full explanation with examples.
What is the mean and standard deviation of 0, 10, 20, 30, 40?
Standard deviation is a measure of how spread out a set of numbers is around their mean. It is the square root of the average squared distance from the mean, expressed in the same units as the original data. A small standard deviation means values cluster close to the mean; a large one means they are widely scattered. See what is standard deviation for a full explanation with examples.
What is the variance of 15, 18, 18, 20, 24?
Standard deviation is a measure of how spread out a set of numbers is around their mean. It is the square root of the average squared distance from the mean, expressed in the same units as the original data. A small standard deviation means values cluster close to the mean; a large one means they are widely scattered. See what is standard deviation for a full explanation with examples.
What is the mean and standard deviation of 15, 18, 18, 20, 24?
Standard deviation is a measure of how spread out a set of numbers is around their mean. It is the square root of the average squared distance from the mean, expressed in the same units as the original data. A small standard deviation means values cluster close to the mean; a large one means they are widely scattered. See what is standard deviation for a full explanation with examples.
Why does R give a different standard deviation result?
Standard deviation is a measure of how spread out a set of numbers is around their mean. It is the square root of the average squared distance from the mean, expressed in the same units as the original data. A small standard deviation means values cluster close to the mean; a large one means they are widely scattered. See what is standard deviation for a full explanation with examples.
How can I check a R standard deviation result with an online calculator?
Standard deviation is a measure of how spread out a set of numbers is around their mean. It is the square root of the average squared distance from the mean, expressed in the same units as the original data. A small standard deviation means values cluster close to the mean; a large one means they are widely scattered. See what is standard deviation for a full explanation with examples.
Why does JavaScript give a different standard deviation result?
Standard deviation is a measure of how spread out a set of numbers is around their mean. It is the square root of the average squared distance from the mean, expressed in the same units as the original data. A small standard deviation means values cluster close to the mean; a large one means they are widely scattered. See what is standard deviation for a full explanation with examples.
How can I check a JavaScript standard deviation result with an online calculator?
Standard deviation is a measure of how spread out a set of numbers is around their mean. It is the square root of the average squared distance from the mean, expressed in the same units as the original data. A small standard deviation means values cluster close to the mean; a large one means they are widely scattered. See what is standard deviation for a full explanation with examples.
Why does Java give a different standard deviation result?
Standard deviation is a measure of how spread out a set of numbers is around their mean. It is the square root of the average squared distance from the mean, expressed in the same units as the original data. A small standard deviation means values cluster close to the mean; a large one means they are widely scattered. See what is standard deviation for a full explanation with examples.
How can I check a Java standard deviation result with an online calculator?
Standard deviation is a measure of how spread out a set of numbers is around their mean. It is the square root of the average squared distance from the mean, expressed in the same units as the original data. A small standard deviation means values cluster close to the mean; a large one means they are widely scattered. See what is standard deviation for a full explanation with examples.
Why does C++ give a different standard deviation result?
Standard deviation is a measure of how spread out a set of numbers is around their mean. It is the square root of the average squared distance from the mean, expressed in the same units as the original data. A small standard deviation means values cluster close to the mean; a large one means they are widely scattered. See what is standard deviation for a full explanation with examples.
How can I check a C++ standard deviation result with an online calculator?
Standard deviation is a measure of how spread out a set of numbers is around their mean. It is the square root of the average squared distance from the mean, expressed in the same units as the original data. A small standard deviation means values cluster close to the mean; a large one means they are widely scattered. See what is standard deviation for a full explanation with examples.
Why does SQL give a different standard deviation result?
Standard deviation is a measure of how spread out a set of numbers is around their mean. It is the square root of the average squared distance from the mean, expressed in the same units as the original data. A small standard deviation means values cluster close to the mean; a large one means they are widely scattered. See what is standard deviation for a full explanation with examples.
How can I check a SQL standard deviation result with an online calculator?
Standard deviation is a measure of how spread out a set of numbers is around their mean. It is the square root of the average squared distance from the mean, expressed in the same units as the original data. A small standard deviation means values cluster close to the mean; a large one means they are widely scattered. See what is standard deviation for a full explanation with examples.
What is the difference between sigma and s in standard deviation?
Standard deviation is a measure of how spread out a set of numbers is around their mean. It is the square root of the average squared distance from the mean, expressed in the same units as the original data. A small standard deviation means values cluster close to the mean; a large one means they are widely scattered. See what is standard deviation for a full explanation with examples.