Learn
How to find standard deviation on a Casio calculator
Switch to statistics mode, enter each value, then open the one-variable results. Read sx for a sample or σx for a population — older models label them xσn−1 and xσn. The exact keys depend on which family your calculator belongs to.
Which Casio do you have?
| Family | Models | How to tell | Sample / population label |
|---|---|---|---|
| ClassWiz CW | fx-991CW, fx-570CW, fx-83GT CW, fx-85GT CW | A HOME key, an OK key and an EXE key | sx / σx |
| ClassWiz EX | fx-991EX, fx-570EX | A MENU key opens a grid of app icons | sx / σx |
| ES PLUS and GT PLUS | fx-991ES PLUS, fx-115ES PLUS, fx-570ES PLUS, fx-83GT PLUS, fx-85GT PLUS | Natural textbook display, a MODE key, no MENU | sx / σx |
| MS | fx-82MS, fx-85MS, fx-300MS, fx-350MS, fx-570MS, fx-991MS | Two-line display; M+ is also labelled DT | sx / σx (older printings: xσn−1 / xσn) |
| Graphing | fx-CG50 and similar | Colour graphing screen, F1–F6 keys | sx / σx |
Every sequence below is taken from Casio's own user's guide for that model, listed under sources at the end of the page. Numbers in brackets are the menu item to press, with its on-screen name after it.
Casio fx-991CW, fx-570CW and fx-83GT / 85GT CW
- Open Statistics. Press HOME, select the Statistics icon and press OK. Select 1-Variable and press OK. A table with an x column opens.
- Enter the data. Type each value and press EXE.
- Open the results. Press OK, select 1-Var Results and press OK.
- Read the answer. The first screen shows x̄ and σx (population); press ▼ to reach sx (sample) and n. Press AC to go back to the table.
Casio fx-991EX and fx-570EX
- Open Statistics. Press MENU, select the Statistics icon and press =. Press 1 (1-Variable). A table with an x column opens.
- Enter the data. Type each value and press =.
- Open the results. Still in the table, press OPTN 3 (1-Variable Calc). If you pressed AC first, the same item is OPTN 2.
- Read the answer. σx is the population standard deviation and sx the sample one, with x̄ and n in the same list.
Casio fx-991ES PLUS, fx-115ES PLUS and fx-83GT / 85GT PLUS
- Open STAT mode. ES PLUS: MODE 3 (STAT). GT PLUS: MODE 2 (STAT). Then press 1 (1-VAR).
- Enter the data. Type each value and press =.
- Leave the table. Press AC.
- Show the result. Press SHIFT 1 (STAT) 4 (Var), then 4 (sx) for the sample standard deviation or 3 (σx) for the population one, and press =. In the same menu, 1 is n and 2 is x̄.
Casio fx-82MS, fx-350MS, fx-570MS and fx-991MS
- Open SD mode. fx-82MS, fx-85MS, fx-300MS and fx-350MS: MODE 2 (SD). fx-570MS and fx-991MS: MODE MODE 1 (SD).
- Clear old data. Press SHIFT MODE (CLR) 1 (Scl) =. Skipping this is the usual cause of a wrong answer: SD mode keeps the last problem's values.
- Enter the data. Type each value and press M+, which acts as the DT (data) key in SD mode.
- Show the result. Press SHIFT 2 (S-VAR), then 3 (sx) for the sample standard deviation or 2 (σx) for the population one, and press =. 1 in the same menu is x̄. Older printings label the two xσn−1 and xσn.
Casio graphing calculators (fx-CG50 and similar)
- Open Statistics. Press MENU and choose Statistics.
- Enter the data. Type the values into List 1, pressing EXE after each.
- Calculate. Press F2 (CALC), then F1 (1-VAR). The results list σx and sx, with x̄ and n above them.
Entering a frequency table
When the data arrives as values with counts — a score of 7 that occurred 4 times — enter each value once with its frequency rather than typing it four times:
- ClassWiz CW: in the table, press TOOLS and select Frequency → On, then AC to return. A Freq column appears.
- ClassWiz EX: SHIFT MENU (SETUP) ▼ 3 (Statistics) 1 (On), then open Statistics as usual. A Freq column appears.
- ES PLUS: SHIFT MODE (SETUP) ▼ 4 (STAT) 1 (ON). GT PLUS: the same STAT ON setting is on the SETUP menu (SHIFT MODE). A FREQ column appears.
- MS: type the value, then SHIFT , (the ; symbol), then the frequency, then M+. For example
7 ; 4 M+enters 7 four times.
Changing the frequency setting clears the data already in the table, so switch it on before you start typing. For class intervals such as 10–19, enter each midpoint as the value. The result is then an estimate; the grouped data calculator explains how far off it can be.
When the answer looks wrong
- Wrong one of the two. sx is always larger than σx. If your answer is slightly too big or too small, you probably read the other one.
- Leftover data. Check that n in the results matches the number of values you meant to enter. MS models keep old data until you clear it with SHIFT MODE (CLR) 1 (Scl) =; on ClassWiz CW, TOOLS → Edit → Delete All empties the table.
- Only one value. The sample formula divides by n − 1, so sx needs at least two values.
- Frequency column switched on by accident. Every Freq cell defaults to 1, but a stray 0 or 2 changes the result. Turn the column off if you do not need it.
Check the calculator's answer
Type the same numbers below. The sample result matches sx (xσn−1), and switching to Population matches σx (xσn). Every step of the working is shown if you need to find where a hand calculation went wrong.
Separate numbers with commas, spaces or new lines, or paste a spreadsheet column.
Decimals and negatives are fine; write 10:3 for a value that occurs 3 times.
Your results will appear here: the standard deviation first, then the rest of the summary and a chart.
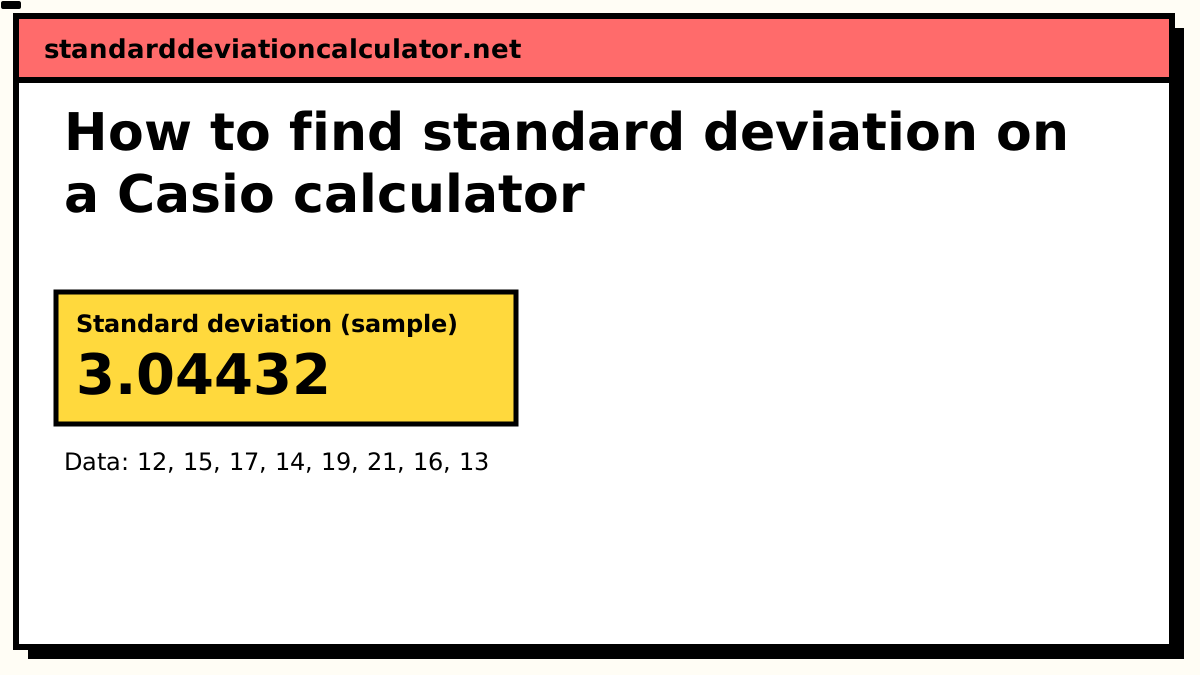
Standard deviation (sample)
3.04432
3.04
Your values typically sit about 3.04 above or below their mean of 15.88, in the same units as your data. 5 of 8 values (63%) fall between 12.83 and 18.92, within one standard deviation of the mean; for normally distributed data about 68% would.
Population SD (σ): 2.8477, if these values are the whole group.
- Count (n)
- 8
- Mean (x̄)
- 15.875
- Variance (s²)
- 9.26786
- Standard error
- 1.07633
- Minimum
- 12
- Q1 (25%)
- 13.75
- Median
- 15.5
- Q3 (75%)
- 17.5
- Maximum
- 21
- Range
- 9
More statistics (5)
- Relative SD (%RSD)
- 19.1768%
- Coefficient of variation
- 0.191768
- Sum (Σx)
- 127
- Sum of squares, Σ(x − x̄)²
- 64.875
- IQR (Q3 − Q1)
- 3.75
Data distribution
Shaded bands mark ±1, ±2 and ±3 SD from the mean. 5 of 8 values (63%) fall within ±1 SD.
Chart as text
Mean 15.875, sample standard deviation s = 3.04432, from 8 values between 12 and 21.
- Within ±1 SD (12.83 to 18.92): 5 of 8 values (63%). About 68% for normal data.
- Within ±2 SD: 8 (100%). About 95% for normal data.
- Within ±3 SD: 8 (100%). About 99.7% for normal data.
Show the working, step by step
Sources
Key sequences are taken from Casio's user's guides:
- fx-570CW / fx-991CW User's Guide, "Statistical Calculations", pp. 66–71
- fx-570EX / fx-991EX User's Guide, "Statistical Calculations", pp. 20–22
- fx-570ES PLUS / fx-991ES PLUS User's Guide, "Statistical Calculations (STAT)", pp. E-22–E-23
- fx-83GT PLUS / fx-85GT PLUS User's Guide, "Statistical Calculations (STAT)", pp. E-21–E-22
- fx-82MS / 85MS / 300MS / 350MS User's Guide, "Standard Deviation (SD)", p. 33
- fx-570MS / fx-991MS User's Guide, "Standard Deviation (SD)"
- Casio Education: Using the fx-CG50 for statistics
Related calculators
-
Standard deviation calculator
Check the value your Casio gave you, with every step shown.
-
SD on a TI-84
The same job on a Texas Instruments graphing calculator.
-
Sx, σx and friends
What every standard deviation symbol on a calculator means.
-
Sample or population?
How to decide which of the two results to read.
Common questions
Which value on a Casio calculator is the standard deviation?
Casio shows two. sx (or xσn−1 on older MS printings) is the sample standard deviation, which divides by n − 1. σx (or xσn) is the population standard deviation, which divides by n.
If the question says "sample", or does not say, use sx.
What is SD mode on a Casio calculator?
On the fx-82MS family and other MS models, SD is the name of the statistics mode: Standard Deviation mode, reached with MODE 2 (or MODE MODE 1 on the fx-570MS and fx-991MS). In it the M+ key stops adding to memory and becomes the data-entry key, labelled DT. Newer models call the same thing STAT or Statistics.
Why can my Casio not give sx for a single value?
The sample standard deviation divides by n − 1, which is zero when n = 1, so it cannot be calculated and the calculator reports an error. Enter at least two values, or read σx if the single value really is the whole population.
Why does my Casio give a different answer from the textbook?
Almost always one of two things: you read σx where the book wanted sx (or the reverse), or values from a previous problem were still in the data table. Check the count n in the results against the number of values you meant to enter.