Finance
Retirement calculator
Enter your age, savings, monthly contribution and the income you want in retirement. The calculator projects the pot at your retirement age, checks whether it can pay that income, rising with inflation, until the age you plan for, and shows how much more you would need to save if not.
State pension, Social Security, annuity. Leave 0 if none.
━ Savings balance
| Age | Phase | Paid in / taken out | Balance at year end |
|---|---|---|---|
| 31 | Saving | $12,000 | $65,880 |
| 32 | Saving | $12,000 | $82,872 |
| 33 | Saving | $12,000 | $101,054 |
| 34 | Saving | $12,000 | $120,508 |
| 35 | Saving | $12,000 | $141,323 |
| 36 | Saving | $12,000 | $163,596 |
| 37 | Saving | $12,000 | $187,428 |
| 38 | Saving | $12,000 | $212,929 |
| 39 | Saving | $12,000 | $240,214 |
| 40 | Saving | $12,000 | $269,409 |
| 41 | Saving | $12,000 | $300,648 |
| 42 | Saving | $12,000 | $334,074 |
| 43 | Saving | $12,000 | $369,839 |
| 44 | Saving | $12,000 | $408,108 |
| 45 | Saving | $12,000 | $449,056 |
| 46 | Saving | $12,000 | $492,871 |
| 47 | Saving | $12,000 | $539,752 |
| 48 | Saving | $12,000 | $589,915 |
| 49 | Saving | $12,000 | $643,589 |
| 50 | Saving | $12,000 | $701,021 |
| 51 | Saving | $12,000 | $762,472 |
| 52 | Saving | $12,000 | $828,226 |
| 53 | Saving | $12,000 | $898,582 |
| 54 | Saving | $12,000 | $973,863 |
| 55 | Saving | $12,000 | $1,054,414 |
| 56 | Saving | $12,000 | $1,140,603 |
| 57 | Saving | $12,000 | $1,232,825 |
| 58 | Saving | $12,000 | $1,331,503 |
| 59 | Saving | $12,000 | $1,437,089 |
| 60 | Saving | $12,000 | $1,550,065 |
| 61 | Saving | $12,000 | $1,670,950 |
| 62 | Saving | $12,000 | $1,800,297 |
| 63 | Saving | $12,000 | $1,938,698 |
| 64 | Saving | $12,000 | $2,086,787 |
| 65 | Saving | $12,000 | $2,245,243 |
| 66 | Drawing | −$140,693 | $2,209,777 |
| 67 | Drawing | −$144,914 | $2,168,106 |
| 68 | Drawing | −$149,261 | $2,119,787 |
| 69 | Drawing | −$153,739 | $2,064,350 |
| 70 | Drawing | −$158,351 | $2,001,299 |
| 71 | Drawing | −$163,102 | $1,930,107 |
| 72 | Drawing | −$167,995 | $1,850,218 |
| 73 | Drawing | −$173,035 | $1,761,042 |
| 74 | Drawing | −$178,226 | $1,661,957 |
| 75 | Drawing | −$183,573 | $1,552,304 |
| 76 | Drawing | −$189,080 | $1,431,385 |
| 77 | Drawing | −$194,752 | $1,298,464 |
| 78 | Drawing | −$200,595 | $1,152,763 |
| 79 | Drawing | −$206,613 | $993,458 |
| 80 | Drawing | −$212,811 | $819,680 |
| 81 | Drawing | −$219,195 | $630,508 |
| 82 | Drawing | −$225,771 | $424,974 |
| 83 | Drawing | −$232,544 | $202,051 |
| 84 | Drawing | −$202,051 | $0 |
Show the working, step by step
Grow today’s $50,000 and $1,000 a month for 35 years at 7.00% a year (0.5654% a month).
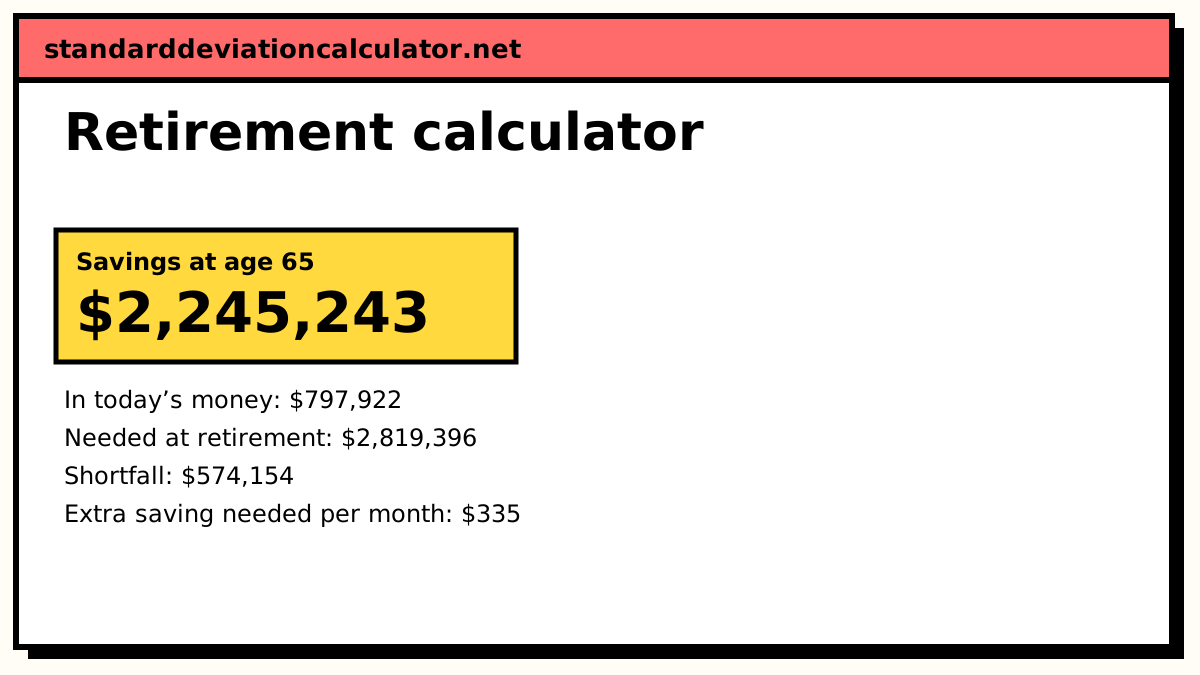
savings at 65 = $2,245,243
Convert to today’s money by removing 35 years of 3.00% inflation.
$2,245,243 ÷ 1.0300^35 = $797,922
The income you need from savings is $50,000 − $0 = $50,000 a year in today’s money. In 35 years’ time that is
$50,000 × 1.0300^35 = $140,693 in the first year
To draw that at the start of each of 25 years, rising with inflation, while the rest earns 5.00%, you need the present value of a growing annuity:
required = Σ $140,693 × (1.0300 ÷ 1.0500)^k, for k = 0 … 24 = $2,819,396
Compare with the projection, and spread the gap over the remaining months.
shortfall = $2,819,396 − $2,245,243 = $574,154 extra per month = shortfall ÷ ((1 + i)^420 − 1) ÷ i = $335.48
4% rule check: take 4% of the pot in the first year.
0.04 × $2,245,243 = $89,810 ($31,917 in today’s money)
These results are estimates from the figures you entered. Real returns vary from year to year, and fees and taxes are not included. This is a calculation, not financial advice.
How the calculation works
There are two phases.
Saving. Current savings and a monthly contribution grow at the pre-retirement return:
pot = S(1 + r₁)^Y + C × ((1 + i)^(12Y) − 1) ÷ i, i = (1 + r₁)^(1/12) − 1
Drawing. The income you want, minus any pension, is inflated to the retirement date and taken at the start of each retirement year, rising with inflation g, while the rest earns the post-retirement return r₂. The pot needed is the present value of that growing income over R years:
needed = W × Σ ((1 + g) ÷ (1 + r₂))^k, k = 0 … R − 1
The shortfall is needed − pot, spread over the months left with the same annuity formula.
A worked example
The defaults: age 30, retiring at 65, planning to 90; $50,000 saved and $1,000 a month added; 7% before retirement, 5% after, 3% inflation; $50,000 a year wanted in today’s money.
- After 35 years the pot is $2,245,243, or $797,922 in today’s money.
- $50,000 today is $50,000 × 1.03^35 = $140,693 in the first year of retirement.
- Funding that for 25 years, rising 3% a year, with the rest earning 5%, needs $2,819,396.
- Shortfall: $2,819,396 − $2,245,243 = $574,154. Saving an extra $335 a month for the 35 years closes it.
- Without the extra saving the pot runs out after about 18.8 years, at about age 84.
Retiring at 67 instead gives two more years of saving and two fewer of drawing: the pot grows to $2,596,206, but the gap is still about $204,905. Small changes to the inflation rate or the income target move the answer by as much as that, so try a few versions.
The 4% rule, and its caveats
The 4% rule says a first-year withdrawal of 4% of the pot, then increased with inflation, has historically lasted about 30 years. By that rule, the $2,245,243 pot supports $89,810 in the first year, which is $31,917 in today’s money, well short of the $50,000 wanted. To draw $50,000 in today’s money by the rule you would need 25 × $50,000 = $1.25 million in today’s money.
- It comes from historical US share and bond returns. Other countries, and future returns, may be lower.
- It targets 30 years. Retiring early, or living to 100, needs a lower rate.
- It ignores fees and taxes, which reduce what you can safely take.
- A bad run of returns in the first years of retirement does more damage than the same run later (sequence risk). A flexible plan that trims spending after poor years copes better.
This calculator uses a fixed return, so it cannot show sequence risk. Treat its answer as an estimate to plan around, not advice. A regulated financial adviser can look at your whole situation.
Common questions
How much do I need to retire?
Enough that the savings, drawn down year by year and still invested, cover the income you want until the age you plan for. This calculator finds that figure as the present value of an inflation-linked income: in the default example, $50,000 a year in today’s money from 65 to 90, with 3% inflation and a 5% return in retirement, needs $2,819,396 at 65, which is about $1.0 million in today’s money.
What is the 4% rule?
A rule of thumb from US research in the 1990s (Bengen, and the “Trinity study”): withdraw 4% of the pot in the first year of retirement, then raise that cash amount with inflation each year, and a mix of US shares and bonds historically lasted at least 30 years in most periods tested. Put the other way, you need about 25 times the first year’s spending. It is a starting point, not a guarantee; see the caveats on this page.
Why is the answer in today’s money different from the projected balance?
Because prices rise while you save. $2,245,243 in 35 years, at 3% inflation, buys about what $797,922 buys today (divide by 1.03^35 = 2.8139). Judge whether the pot is enough in today’s money, since that is how you know what things cost.
What return and inflation should I use?
Use figures you would be comfortable relying on; this page does not recommend any. Returns after retirement are usually set lower than before, because most people hold more bonds and cash as they age. Inflation over long periods has often been 2–3% a year in the US and UK and higher in India. Try a pessimistic case as well as your central one.
Should I include a state pension or Social Security?
Yes, if you expect one. Enter it in today’s money in “Pension or other income”. It is subtracted from the income you want, so savings only need to fund the gap. In the default example, $15,000 a year of pension brings the shortfall to zero and the savings last about 29.6 years.
Related calculators
-
Investment calculator
Grow savings with regular contributions, year by year.
-
Inflation calculator
Convert between future and today’s money.
-
Compound interest
The formula behind long-term growth.
-
Finance (TVM) calculator
Test a withdrawal plan as an annuity.