Relative standard deviation calculator (%RSD)
Enter your replicate measurements to get the relative standard deviation as a percentage, alongside the standard deviation and mean it is built from. The working is shown step by step.
Separate numbers with commas, spaces or new lines, or paste a spreadsheet column.
Decimals and negatives are fine; write 10:3 for a value that occurs 3 times.
Your results will appear here: the standard deviation first, then the rest of the summary and a chart.
Relative standard deviation
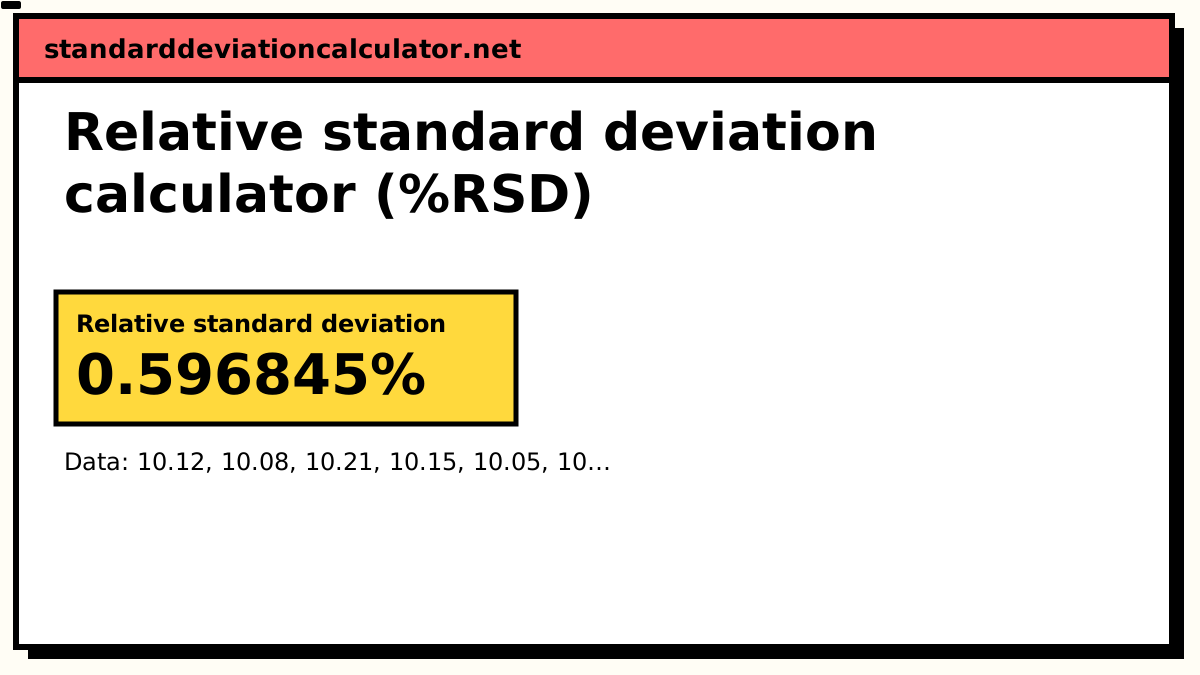
0.596845%
The standard deviation (0.06047) is 0.597% of the mean (10.13). Because it has no units, this figure can be compared across datasets measured on different scales.
- Count (n)
- 6
- Mean (x̄)
- 10.1317
- Standard deviation (s)
- 0.0604704
- Variance (s²)
- 0.00365667
- Minimum
- 10.05
- Q1 (25%)
- 10.09
- Median
- 10.135
- Q3 (75%)
- 10.1725
- Maximum
- 10.21
- Range
- 0.16
More statistics (5)
- Standard error
- 0.0246869
- Coefficient of variation
- 0.00596845
- Sum (Σx)
- 60.79
- Sum of squares, Σ(x − x̄)²
- 0.0182833
- IQR (Q3 − Q1)
- 0.0825
Data distribution
Shaded bands mark ±1, ±2 and ±3 SD from the mean. 4 of 6 values (67%) fall within ±1 SD.
Chart as text
Mean 10.1317, sample standard deviation s = 0.0604704, from 6 values between 10.05 and 10.21.
- Within ±1 SD (10.07 to 10.19): 4 of 6 values (67%). About 68% for normal data.
- Within ±2 SD: 6 (100%). About 95% for normal data.
- Within ±3 SD: 6 (100%). About 99.7% for normal data.
Show the working, step by step
What RSD tells you that standard deviation cannot
A standard deviation is an absolute quantity carrying the units of the data, which makes it useless for comparing across scales. Consider two analytical methods:
| Method | Mean | SD | %RSD |
|---|---|---|---|
| Trace metal assay | 0.42 ppm | 0.021 ppm | 5.0% |
| Bulk content assay | 250 mg | 2.5 mg | 1.0% |
The bulk assay has a standard deviation more than a hundred times larger, and yet it is the considerably more precise method. Only the RSD makes that visible, because it measures spread as a proportion of what is being measured.
Relative standard deviation formula
%RSD = 100 × s / |x̄|
where s is the sample standard deviation and x̄ the sample mean. The
absolute value on the mean keeps the result positive; some sources omit it and report a
signed RSD, though a negative mean is a sign that RSD is the wrong statistic for the data
in the first place.
Analytical work almost always uses the sample standard deviation here, since replicate measurements are a sample of what the method would produce on repetition. That is the default above.
Relative standard deviation: a worked example
Six replicate injections give 10.12, 10.08, 10.21, 10.15, 10.05, 10.18 mg/mL.
- Sum = 60.79 over n = 6, so the mean is 10.1317 mg/mL.
- The squared deviations sum to Σ(x − x̄)² = 0.0182833.
- Dividing by n − 1 = 5 gives a variance of 0.00365667, so s = 0.0604704 mg/mL.
- %RSD = 100 × 0.0604704 ÷ 10.1317 = 0.5968%.
Against a 2% acceptance criterion, this set passes comfortably. Those exact numbers are loaded into the calculator above. Open the working to see each squared deviation.
RSD, CV, and what to call it
Relative standard deviation and coefficient of variation are the same calculation. Which name you meet depends on the field:
- %RSD: analytical chemistry, pharmacopoeial methods, quality control, metrology.
- CV: statistics, epidemiology, finance, laboratory medicine.
- CV%: a common hybrid, identical to %RSD.
Outside those fields it is also called the percentage standard deviation: the standard deviation expressed as a percentage of the mean.
There is one genuine distinction worth knowing: some laboratory standards separate repeatability RSD (same analyst, same instrument, same day) from reproducibility RSD (varying those factors). The arithmetic is identical; what differs is which sources of variation the replicates were allowed to contain.
A related ratio divides the standard error of an estimate, rather than the data's standard deviation, by the estimate. That is the relative standard error, which survey agencies use to flag estimates too unreliable to publish.
How to calculate %RSD in Excel
Excel has no RSD function, so you build it from the two it does have. With your replicates
in A1:A6:
| What you want | Formula |
|---|---|
| %RSD from a sample | =100*STDEV.S(A1:A6)/ABS(AVERAGE(A1:A6)) |
| %RSD from a population | =100*STDEV.P(A1:A6)/ABS(AVERAGE(A1:A6)) |
| CV as a ratio, not a percentage | =STDEV.S(A1:A6)/AVERAGE(A1:A6) |
| Shown as a percentage cell | =STDEV.S(A1:A6)/AVERAGE(A1:A6) |
| Rounded to two decimals | =ROUND(100*STDEV.S(A1:A6)/ABS(AVERAGE(A1:A6)),2) |
| %RSD per batch, from a label column | =100*STDEV.S(IF(B:B=D1,A:A))/ABS(AVERAGEIF(B:B,D1,A:A)) |
Four things reliably go wrong with this. Use STDEV.S, not
STDEV.P: replicate injections are a sample of what the method would produce,
so n − 1 is the right denominator, and the older STDEV is just STDEV.S under a
legacy name. Keep the ABS() on the mean or a negative mean flips the sign.
For the fourth row, format the cell as a percentage rather than multiplying by 100, because
doing both reports 59.68% for a set whose real RSD is 0.5968%. And the last row is an array
formula: in Excel 2019 and earlier commit it with
Ctrl+Shift+Enter, though in Microsoft 365 it spills on its
own.
Google Sheets is identical except that it accepts the legacy
STDEV spelling everywhere and needs no array commit. The
Excel standard deviation guide covers
STDEV.S, STDEV.P, conditional variants and the errors they throw;
the CV calculator reports the same figure
as a ratio.
When not to use RSD
- The mean is at or near zero. The ratio becomes unstable and then undefined.
- The scale is interval, not ratio. Temperature in °C or °F has an arbitrary zero, so a percentage of the mean is meaningless. Convert to kelvin first, or use the plain standard deviation.
- The data can be negative. Returns, deviations from a target, and differences all fail the ratio-scale requirement.
- The sample is tiny. With n = 3, the RSD is itself estimated so imprecisely that comparing two values of it is rarely justified.
What is a good %RSD?
There is no single threshold. What counts as acceptable is set by the method, the laboratory's procedure or a regulator, and it depends on how precise the measurement can realistically be. Two published limits show the range:
| Context | Limit | Source |
|---|---|---|
| HPLC injection repeatability (system suitability, at least 5 injections of the active drug) | ≤ 1% (described as desirable) | FDA CDER, Reviewer Guidance: Validation of Chromatographic Methods (1994) |
| Bioanalytical assays, chromatographic: precision at each QC level | ≤ 15%; ≤ 20% at the LLOQ | ICH M10, Bioanalytical Method Validation and Study Sample Analysis (FDA, 2022) |
The two differ by more than an order of magnitude because they measure different things: an instrument injecting the same solution repeatedly, and a whole assay run on biological samples. Your method or SOP states the limit that applies to you, and that number overrides both. Why a higher %RSD is accepted at low concentrations, and what makes an RSD too high, are covered in what is a good relative standard deviation.
Related calculators
-
Coefficient of variation
The same statistic, reported as a ratio rather than a percentage.
-
Standard deviation calculator
The absolute spread that RSD is built from.
-
Pooled SD
Combining precision estimates across several runs or batches.
-
Standard error
How precisely the mean itself is known.
-
What is a good %RSD?
Limits in chemistry, low concentrations, and when an RSD is too high.
Common questions
What is relative standard deviation?
The relative standard deviation (RSD) is the standard deviation expressed as a
percentage of the mean: %RSD = 100 × s / |x̄|. Because the units cancel, it is
a pure number, which lets you compare the consistency of measurements taken on completely
different scales.
It is the same quantity as the coefficient of variation. RSD is the name used in analytical chemistry and quality control; CV is the name used in statistics and finance.
What is a good %RSD?
There is no universal cut-off: the limit comes from the method or regulator, not from statistics. Two published examples are ≤ 1% for replicate HPLC injections and ≤ 15% for bioanalytical assays (≤ 20% at the lower limit of quantification); the section above gives the sources.
Is RSD the same as the coefficient of variation?
Yes, with one wrinkle of convention: RSD is nearly always quoted as a percentage, while the coefficient of variation is often left as a plain ratio. A CV of 0.08 and an RSD of 8% are the same thing. This calculator reports both.
Why does RSD break down when the mean is near zero?
Because the mean is in the denominator. As it approaches zero the ratio explodes towards infinity, and the number stops carrying any useful meaning. If the mean is exactly zero the RSD is undefined and this calculator will say so.
RSD is only meaningful for data on a ratio scale with a genuine, meaningful zero: mass, concentration, count, elapsed time. It is not appropriate for temperature in °C, or for any quantity that can legitimately be negative.
How do I calculate RSD in Excel?
There is no built-in RSD function. Divide the standard deviation by the mean and multiply by 100:
=STDEV.S(A1:A10)/AVERAGE(A1:A10)*100
Use STDEV.P instead if the values are a complete population. Wrap the mean
in ABS() if it could be negative.
Frequently asked questions about relative standard deviation
Common questions
Can a standard deviation calculator handle a dataset with percentages?
Standard deviation works with decimal values the same way as integers. The formula is identical; only the numbers differ. For comparing variability across different scales, use the relative standard deviation calculator. Use the standard deviation calculator for precise results.
Is there a free relative standard deviation calculator?
Standard deviation is a measure of how spread out a set of numbers is around their mean. It is the square root of the average squared distance from the mean, expressed in the same units as the original data. A small standard deviation means values cluster close to the mean; a large one means they are widely scattered. See what is standard deviation for a full explanation with examples.
Can a relative standard deviation calculator show the working?
Standard deviation is a measure of how spread out a set of numbers is around their mean. It is the square root of the average squared distance from the mean, expressed in the same units as the original data. A small standard deviation means values cluster close to the mean; a large one means they are widely scattered. See what is standard deviation for a full explanation with examples.
Can I paste comma-separated values into a relative standard deviation calculator?
Standard deviation is a measure of how spread out a set of numbers is around their mean. It is the square root of the average squared distance from the mean, expressed in the same units as the original data. A small standard deviation means values cluster close to the mean; a large one means they are widely scattered. See what is standard deviation for a full explanation with examples.
Can I download the results from a relative standard deviation calculator?
Standard deviation is a measure of how spread out a set of numbers is around their mean. It is the square root of the average squared distance from the mean, expressed in the same units as the original data. A small standard deviation means values cluster close to the mean; a large one means they are widely scattered. See what is standard deviation for a full explanation with examples.
How accurate is an online relative standard deviation calculator?
Standard deviation is a measure of how spread out a set of numbers is around their mean. It is the square root of the average squared distance from the mean, expressed in the same units as the original data. A small standard deviation means values cluster close to the mean; a large one means they are widely scattered. See what is standard deviation for a full explanation with examples.
What should I do if a relative standard deviation calculator gives an unexpected result?
Standard deviation is a measure of how spread out a set of numbers is around their mean. It is the square root of the average squared distance from the mean, expressed in the same units as the original data. A small standard deviation means values cluster close to the mean; a large one means they are widely scattered. See what is standard deviation for a full explanation with examples.
How do I calculate standard deviation for a dataset with percentages?
Standard deviation works with decimal values the same way as integers. The formula is identical; only the numbers differ. For comparing variability across different scales, use the relative standard deviation calculator. Use the standard deviation calculator for precise results.
How do I calculate relative standard deviation online?
Standard deviation is a measure of how spread out a set of numbers is around their mean. It is the square root of the average squared distance from the mean, expressed in the same units as the original data. A small standard deviation means values cluster close to the mean; a large one means they are widely scattered. See what is standard deviation for a full explanation with examples.
Can I calculate relative standard deviation from a list of numbers?
Standard deviation is a measure of how spread out a set of numbers is around their mean. It is the square root of the average squared distance from the mean, expressed in the same units as the original data. A small standard deviation means values cluster close to the mean; a large one means they are widely scattered. See what is standard deviation for a full explanation with examples.
How can I calculate relative standard deviation step by step?
To calculate standard deviation: (1) Find the mean of the dataset. (2) Subtract the mean from each value. (3) Square each deviation. (4) Sum the squared deviations. (5) Divide by n − 1 (sample) or n (population). (6) Take the square root. See how to calculate standard deviation for a worked example.
What is the easiest way to calculate relative standard deviation?
Standard deviation is a measure of how spread out a set of numbers is around their mean. It is the square root of the average squared distance from the mean, expressed in the same units as the original data. A small standard deviation means values cluster close to the mean; a large one means they are widely scattered. See what is standard deviation for a full explanation with examples.
Can I calculate relative standard deviation on my phone?
Standard deviation is a measure of how spread out a set of numbers is around their mean. It is the square root of the average squared distance from the mean, expressed in the same units as the original data. A small standard deviation means values cluster close to the mean; a large one means they are widely scattered. See what is standard deviation for a full explanation with examples.
How do I calculate relative standard deviation for decimal values?
Standard deviation is a measure of how spread out a set of numbers is around their mean. It is the square root of the average squared distance from the mean, expressed in the same units as the original data. A small standard deviation means values cluster close to the mean; a large one means they are widely scattered. See what is standard deviation for a full explanation with examples.
Can I calculate relative standard deviation for negative numbers?
Standard deviation is a measure of how spread out a set of numbers is around their mean. It is the square root of the average squared distance from the mean, expressed in the same units as the original data. A small standard deviation means values cluster close to the mean; a large one means they are widely scattered. See what is standard deviation for a full explanation with examples.
How do I calculate relative standard deviation when values repeat?
When values repeat, you can enter each occurrence individually or use a frequency table. Both give the same result. The frequency table standard deviation calculator is more efficient for datasets with many repeated values.
Can I calculate relative standard deviation from a frequency table?
Standard deviation is a measure of how spread out a set of numbers is around their mean. It is the square root of the average squared distance from the mean, expressed in the same units as the original data. A small standard deviation means values cluster close to the mean; a large one means they are widely scattered. See what is standard deviation for a full explanation with examples.
How do I calculate relative standard deviation for a small dataset?
Standard deviation is a measure of how spread out a set of numbers is around their mean. It is the square root of the average squared distance from the mean, expressed in the same units as the original data. A small standard deviation means values cluster close to the mean; a large one means they are widely scattered. See what is standard deviation for a full explanation with examples.
How do I calculate relative standard deviation for a large dataset?
For a large population or dataset, the difference between sample SD (n − 1) and population SD (n) becomes negligible: with n = 1000 the gap is only about 0.1%. For large datasets, use the standard deviation calculator or the large dataset standard deviation calculator which uses Welford's numerically stable method.
Which inputs do I need for relative standard deviation?
Standard deviation is a measure of how spread out a set of numbers is around their mean. It is the square root of the average squared distance from the mean, expressed in the same units as the original data. A small standard deviation means values cluster close to the mean; a large one means they are widely scattered. See what is standard deviation for a full explanation with examples.
What should I check before calculating standard deviation for a dataset with percentages?
Standard deviation works with decimal values the same way as integers. The formula is identical; only the numbers differ. For comparing variability across different scales, use the relative standard deviation calculator. Use the standard deviation calculator for precise results.
How do I check my relative standard deviation calculation?
Standard deviation is a measure of how spread out a set of numbers is around their mean. It is the square root of the average squared distance from the mean, expressed in the same units as the original data. A small standard deviation means values cluster close to the mean; a large one means they are widely scattered. See what is standard deviation for a full explanation with examples.
Can I calculate relative standard deviation without Excel?
Standard deviation is a measure of how spread out a set of numbers is around their mean. It is the square root of the average squared distance from the mean, expressed in the same units as the original data. A small standard deviation means values cluster close to the mean; a large one means they are widely scattered. See what is standard deviation for a full explanation with examples.