Relative standard error calculator
Find how precise an estimate is, as a percentage of the estimate. Paste the data, or enter a standard error and the estimate it belongs to, and the calculator gives the RSE and whether it is reliable.
Show the working, step by step
Find the mean and the sample standard deviation.
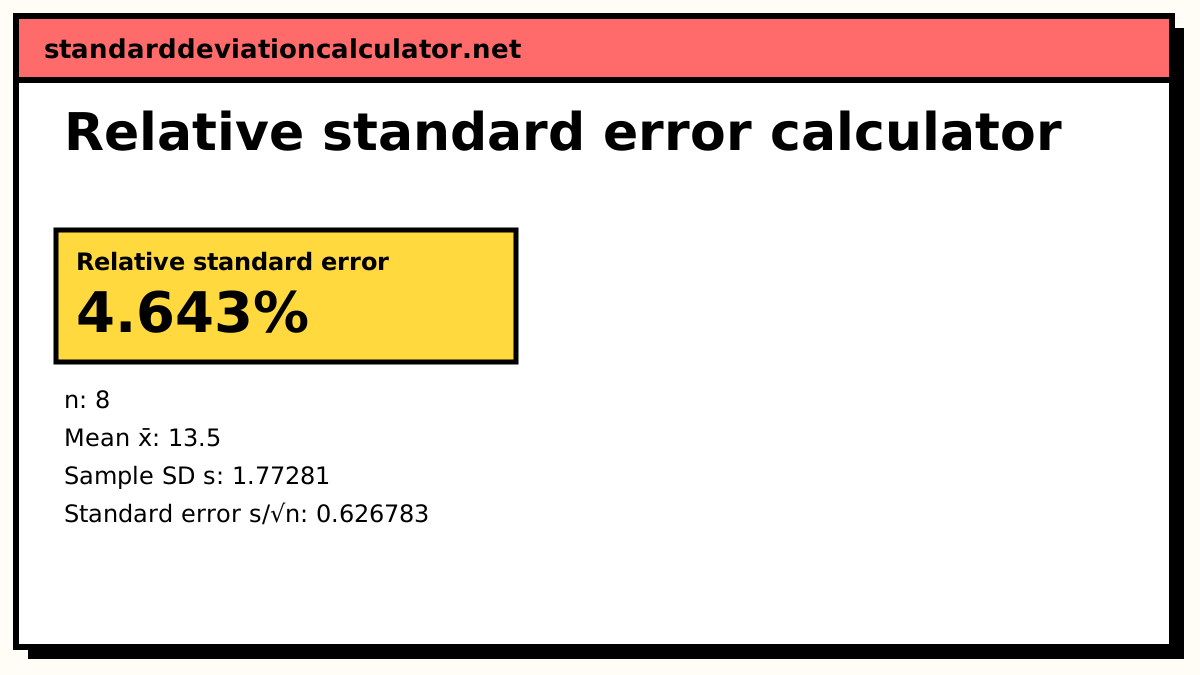
x̄ = 13.5, s = 1.77281
The standard error of the mean:
SE = s ÷ √n = 1.77281 ÷ √8 = 0.626783
Divide by the mean and multiply by 100.
RSE = 0.626783 ÷ 13.5 × 100 = 4.64284%
RSE measures the precision of an estimate, not the spread of the data. The relative standard deviation (coefficient of variation) is s/x̄; the RSE is (s/√n)/x̄, so it shrinks as the sample grows.
The formula
RSE = SE ÷ |estimate| × 100 for a sample mean: RSE = (s ÷ √n) ÷ |x̄| × 100
SE is the standard error, the standard deviation of the estimate across repeated samples. For a mean it is the sample standard deviation divided by the square root of the sample size.
A worked example from data
The default data are eight daily counts: 12, 15, 11, 14, 13, 16, 12 and 15.
- The mean is 108 ÷ 8 = 13.5.
- The squared deviations sum to 22, so s = √(22 ÷ 7) = 1.773.
- The standard error is 1.773 ÷ √8 = 0.6268.
- RSE = 0.6268 ÷ 13.5 × 100 = 4.64%.
The mean of 13.5 is known to within a standard error of about 4.6% of its own size, comfortably under the 25% level at which agencies start to add warnings.
A worked example from a published figure
Survey reports often give an estimate and its standard error. With an estimate of 48 and SE = 2.4, RSE = 2.4 ÷ 48 × 100 = 5%. If you only have the standard deviation and sample size, the third option finds the SE first: s = 6 with n = 25 gives SE = 6 ÷ 5 = 1.2, and with a mean of 48 the RSE is 2.5%.
Interpreting the RSE
A 95% confidence interval for the estimate runs roughly two standard errors either side, so an RSE of 5% means the interval spans about ± 10% of the estimate. At an RSE of 25% the interval is about ± 50%, and at 50% it reaches from near zero to double the estimate, which is why estimates at that level are treated as unreliable.
Because SE falls with √n, quadrupling the sample halves the RSE. That makes RSE a useful planning tool: if a pilot survey gives an RSE of 20% and you need 10%, you need about four times as many responses.
RSE for a proportion
For a sample proportion p̂ from n responses, SE = √(p̂(1 − p̂) ÷ n). A survey finding 20% support from 400 people has SE = √(0.2 × 0.8 ÷ 400) = 0.02, so RSE = 0.02 ÷ 0.2 = 10%. Small proportions have large RSEs even from big samples, which is why estimates for rare groups are the ones most often flagged.
Common mistakes
- Confusing RSE with RSD. RSD = s ÷ x̄ = 13.1% for the default data; RSE = 4.64%.
- Using the population formula for s (dividing by n) on a sample.
- Quoting an RSE for an estimate near zero. Dividing by a tiny estimate makes the RSE explode even when the SE is small.
- Treating a low RSE as proof of no bias. RSE measures sampling variability only.
Common questions
What is the relative standard error?
The standard error of an estimate divided by the estimate itself, usually as a percentage. It expresses the sampling uncertainty of a mean, total or proportion on a scale that does not depend on units, so the precision of different estimates can be compared directly.
How is RSE different from relative standard deviation?
The relative standard deviation (coefficient of variation) is s ÷ x̄ and describes how spread out the individual values are. The relative standard error is (s ÷ √n) ÷ x̄ and describes how precisely the mean is known. RSD stays roughly the same as you collect more data; RSE falls in proportion to 1/√n.
What RSE is acceptable?
Statistical agencies publish rules of thumb. The Australian Bureau of Statistics flags estimates with an RSE between 25% and 50% to be used with caution and treats those above 50% as too unreliable for general use. The US National Center for Health Statistics flags estimates with an RSE above 30%.
Can RSE be used for estimates other than a mean?
Yes. Any estimate with a standard error has an RSE: a survey total, a proportion, a regression coefficient. Use the "standard error and estimate" option and enter the published SE.
Related calculators
-
Standard error calculator
The standard error of the mean, from data or from s and n.
-
Relative standard deviation calculator
RSD, the spread of the data as a percentage of the mean.
-
Coefficient of variation calculator
Compare the spread of data sets with different units or means.