Error and uncertainty calculators
Calculators for how far a measurement, estimate or prediction is from the truth, and for carrying that uncertainty through a calculation. Lab students, engineers and anyone checking a forecast will find the main tools here, along with the entropy and diversity indices used in ecology and information theory.
Which calculator do I need?
| You have or want | Use |
|---|---|
| Several measured values with ± uncertainties, combined in a formula | Error propagation calculator |
| Repeated readings of the same quantity and you need its uncertainty | Uncertainty calculator |
| A ± value to switch between absolute and percentage form | Absolute uncertainty calculator |
| One measured value against a known true or accepted value | Relative error calculator |
| Actual and predicted values from a model or forecast | MSE calculator |
| How precise an estimate is relative to its own size | Relative standard error calculator |
| Species counts from a survey and you want a diversity index | Simpson's diversity index |
Measurement uncertainty
Quantify the uncertainty in lab readings and carry it through to a final result.
-
Uncertainty calculator
Standard uncertainty s/√n and expanded uncertainty U = k·u from repeated readings.
-
Absolute uncertainty calculator
Convert between absolute and percentage uncertainty, or combine uncertainties of a sum.
-
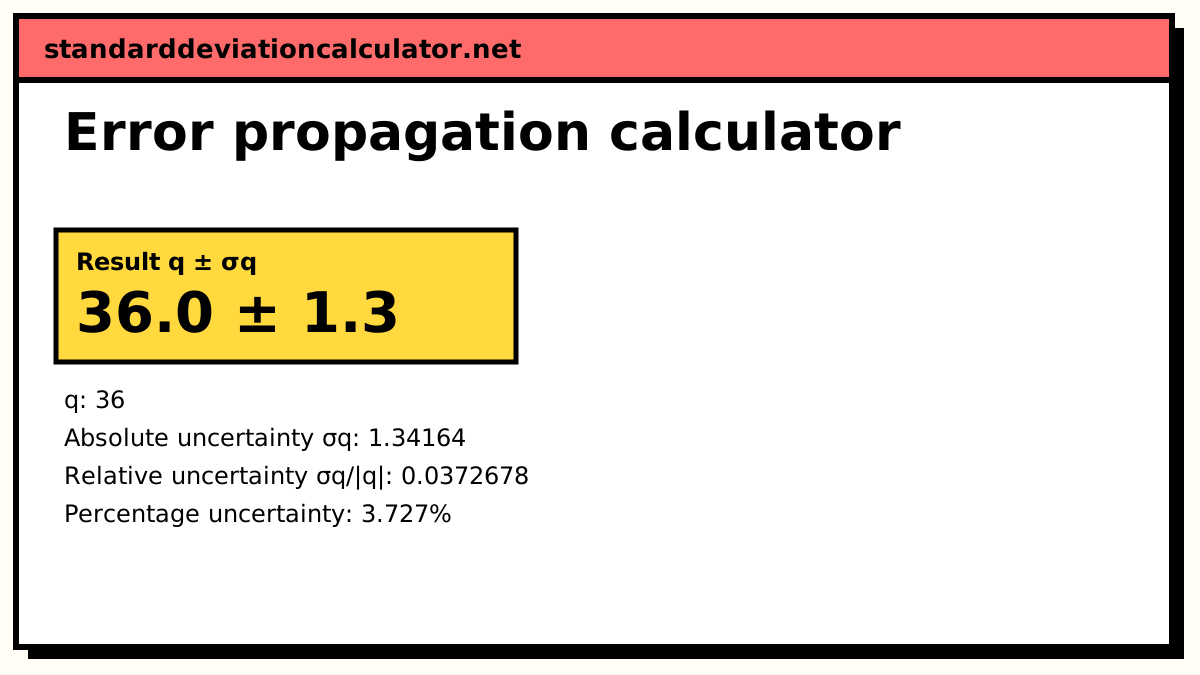
Error propagation calculator
Carry uncertainties through sums, products, powers or any formula f(a, b, c).
-
Relative error calculator
Absolute, relative and percent error of a measurement against the true value.
Prediction and estimate error
How far a model misses the data, and how precise an estimate is.
-
MSE calculator
MSE, RMSE, MAE and MAPE from actual and predicted values.
-
Residual calculator
Residuals, a residual plot and SSE for a least-squares or given line.
-
Relative standard error calculator
RSE = SE ÷ estimate × 100 from data, or from a standard error and estimate.
Standard scores
Move between a raw value and its position in a distribution.
-
Raw score calculator
Turn a z-score or a percentile back into a raw score with x = μ + zσ.
-
Z-score calculator
Z-score from a value, mean and SD, with the percentile, tail areas and two-tailed p-value.
Diversity and information
Indices that measure how evenly counts are spread across categories.
-
Shannon entropy calculator
Entropy from probabilities, counts or text, with the Shannon index H′ and evenness.
-
Simpson's diversity index calculator
D, 1 − D and 1/D from species counts, in the n(n − 1) or Σp² form.
-
Quiz: Simpson's diversity index calculator
Random quadrat questions: work out 1 − D and check it against the full working.
Absolute, relative and propagated error
An absolute uncertainty is in the units of the measurement: 10.0 ± 0.2 cm. A relative uncertainty divides that by the value (0.02, or 2%), which lets you compare the precision of quantities measured in different units. Relative error is the same idea applied to a known true value: measuring 9.8 when the answer is 10 is an absolute error of 0.2 and a relative error of 2%.
When measurements are combined, their uncertainties combine too. Take A = 10.0 ± 0.2 and B = 5.0 ± 0.1, independent. For the sum, absolute uncertainties add in quadrature: A + B = 15.0 ± √(0.2² + 0.1²) = 15.0 ± 0.22. For the product, relative uncertainties add in quadrature: both are 2%, so A × B = 50 ± 50 × √(0.02² + 0.02²) = 50 ± 1.4. Simply adding the uncertainties would give ±0.3 and ±2.0, the worst case, which overstates the typical error. The error propagation calculator applies the general rule to any formula.
Measuring prediction error
A residual is one observed value minus its prediction. The MSE calculator summarises a whole set: for errors of 1, −2 and 3, the mean absolute error is 2, the mean squared error is (1 + 4 + 9) / 3 = 4.67 and the root mean squared error is 2.16. RMSE is in the original units and weights large misses more heavily than MAE does, so the gap between the two hints at occasional big errors.
Common mix-ups
- Standard uncertainty is not the SD of the readings. For the mean of n repeated readings, the standard uncertainty is s / √n, as the uncertainty calculator shows.
- Relative standard error is not relative standard deviation. RSE divides a standard error by its estimate and tells you how reliable that estimate is; %RSD divides the SD by the mean and describes the spread of the data.
- Simpson's D and 1 − D point in opposite directions. D is the chance two individuals picked at random are the same species, so a higher D means less diversity. The calculator reports D, 1 − D and 1/D side by side.
Guides to read alongside
Common questions
How many significant figures should an uncertainty have?
Usually one, or two if the first digit is 1. Then round the measured value to the same decimal place as the uncertainty, so 9.8134 ± 0.0237 becomes 9.81 ± 0.02.
Should I use MSE, RMSE or MAE to compare models?
RMSE is the usual choice because it is in the original units and punishes large errors. Use MAE when occasional large errors should not dominate the comparison, and MAPE when you need a percentage that works across series of different sizes, as long as no actual value is zero.
What is the difference between Shannon and Simpson diversity?
Both rise with the number of species and how evenly individuals are spread among them. Shannon's H′ gives more weight to rare species; Simpson's index is driven mainly by the most common ones. Report whichever your field or course uses, and do not compare values of one with the other.