Raw score calculator
Turn a z-score or a percentile back into a score on the original scale. Enter the mean, the standard deviation and the z-score (or percentile), and the calculator gives the raw score with its position on the normal curve.
Assumes the scores are normally distributed.
━ area below x = 93.32%
Show the working, step by step
Rearrange z = (x − μ)/σ to x = μ + zσ and substitute.
x = 100 + 1.5 × 15 x = 100 + 22.5 = 122.5
The formula works for any distribution; only the percentile needs the normal assumption. With a sample, use x = x̄ + z·s.
The formula
x = μ + z·σ
μ is the mean, σ the standard deviation and z the number of standard deviations above (positive) or below (negative) the mean. For a percentile P, first find z = Φ⁻¹(P/100), the inverse of the standard normal cumulative distribution.
A worked example from a z-score
The default uses an IQ-style scale with μ = 100 and σ = 15, and a z-score of 1.5.
x = 100 + 1.5 × 15 = 100 + 22.5 = 122.5
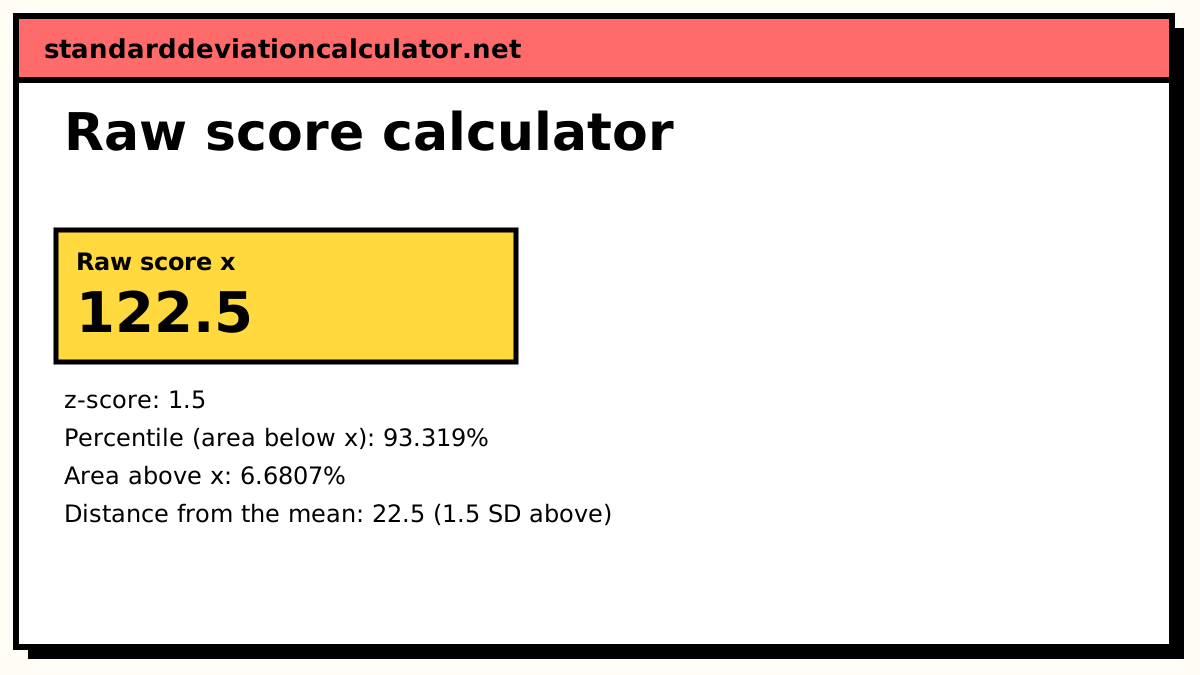
A person 1.5 standard deviations above the mean has a score of 122.5. On a normal distribution 93.3% of scores fall below that, so it is roughly the 93rd percentile.
A worked example from a percentile
Switch the input to a percentile and keep the default of 90. The z-score with 90% of the area to its left is 1.2816, so
x = 100 + 1.2816 × 15 = 119.22
A score of about 119.2 marks the 90th percentile: 90% of people score below it and 10% above. The same method answers questions such as "what score do you need to be in the top 5%?" Enter the 95th percentile, z = 1.6449, and the answer is 100 + 24.7 = 124.7.
Interpreting the result
The raw score is in the units of the original measurement: points, centimetres, seconds. The z-score is unit-free, which is why it is used to compare across tests; converting back is how you report what a standardised result means on a real scale. The chart shades the area below the score, which is the percentile.
The z to raw-score conversion itself is exact for any distribution; it is only a change of scale. The link between z and percentile is where the normal assumption comes in. For test scores, heights and measurement errors it is usually reasonable; for incomes, waiting times and other skewed data it can be badly off in the tails.
Other standard scales
The same formula converts between any standardised scales. T-scores use μ = 50 and σ = 10, so z = 1.5 is a T-score of 65. Stanines use μ = 5 and σ = 2, and many exam boards scale marks to a chosen mean and spread in exactly this way. Convert a score to z on one scale, then use x = μ + zσ with the other scale's mean and standard deviation.
Common mistakes
- Dropping the sign of a negative z-score. z = −1.5 gives 77.5, not 122.5.
- Using the variance instead of the standard deviation. With a variance of 225, σ is 15, not 225.
- Reading a z-table for the area above when you need the area below, which gives the 10th percentile instead of the 90th.
- Applying the percentile method to strongly skewed data.
Common questions
How do you find a raw score from a z-score?
Multiply the z-score by the standard deviation and add the mean: x = μ + zσ. It is the z-score formula z = (x − μ)/σ solved for x.
Can a raw score be below the mean?
Yes. A negative z-score gives a raw score below the mean. With μ = 100 and σ = 15, z = −2 gives x = 100 − 30 = 70.
How do I find the raw score for a percentile?
Find the z-score with that area to its left under the standard normal curve (the 90th percentile is z = 1.2816), then use x = μ + zσ. This assumes the scores are normally distributed. For real data that are skewed, take the percentile of the data directly instead.
Does it matter whether I use a sample or a population?
The arithmetic is the same: use x̄ and s in place of μ and σ when you only have a sample. The result is then the raw score relative to that sample.
Related calculators
-
Z-score calculator
Go the other way: turn a raw score into a z-score.
-
Normal distribution calculator
Probabilities and areas under any normal curve.
-
Percentile calculator
Percentiles of a data set, with the method shown.