Uncertainty calculator
Paste your repeated readings to get the mean, its standard uncertainty and the expanded uncertainty, written the way a lab report or calibration certificate expects: x̄ ± U.
Separate with commas, spaces or new lines.
Adds a Type B term r/(2√3) for the smallest scale division.
━ mean ┄ mean ± U (k = 2)
Show the working, step by step
Average the readings.
x̄ = 78.48 ÷ 8 = 9.81
Find the sample standard deviation (divide by n − 1).
s = √(Σ(x − x̄)² ÷ 7) = 0.02
The standard uncertainty of the mean is the standard error.
u = s ÷ √n = 0.02 ÷ √8 = 0.00707107
Multiply by the coverage factor k = 2.
U = 2 × 0.00707107 = 0.0141421
Round U to two significant figures and the mean to the same decimal place.
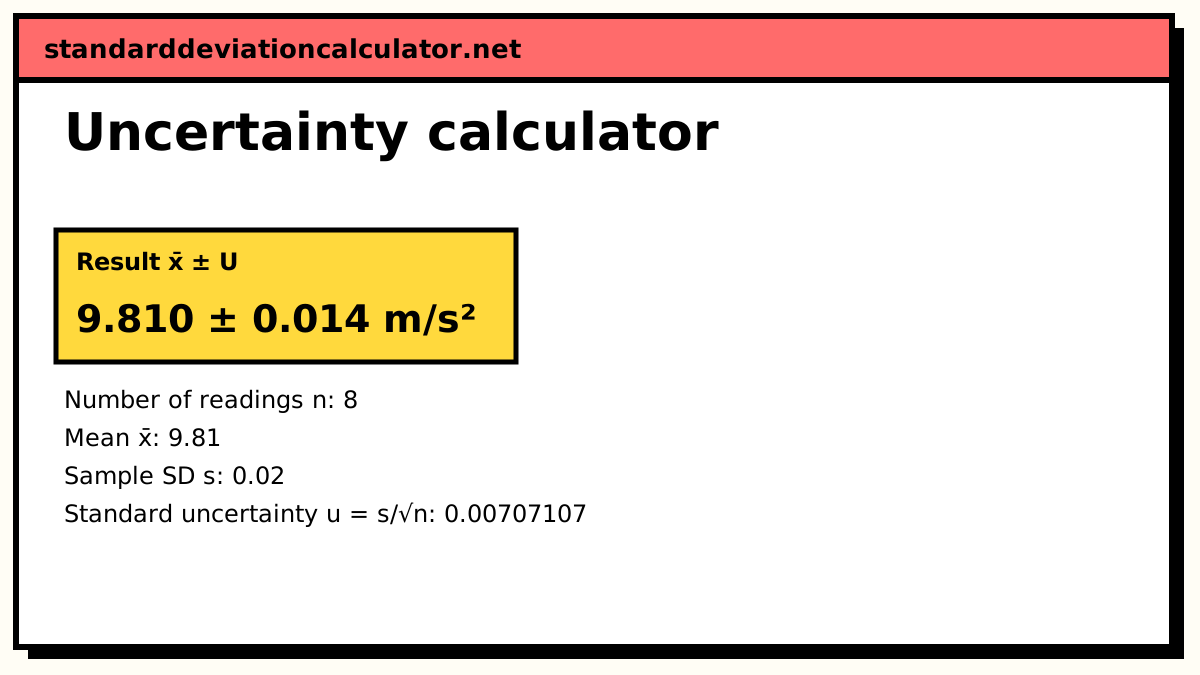
x̄ ± U = 9.810 ± 0.014 m/s²
Type A means the uncertainty was estimated statistically from repeated readings. It captures random scatter only; a systematic error (a miscalibrated instrument) moves every reading and does not show up in s.
The formulas
x̄ = Σx ÷ n s = √(Σ(x − x̄)² ÷ (n − 1)) u = s ÷ √n U = k × u
u is the standard uncertainty of the mean: one standard deviation of the spread you would expect if you repeated the whole set of readings many times. U is the expanded uncertainty, u stretched by a coverage factor k so that the interval x̄ ± U contains the true value with a stated level of confidence.
A worked example
The default is eight timings of a free-fall experiment that each give a value of g in m/s²: 9.81, 9.79, 9.84, 9.80, 9.82, 9.78, 9.83 and 9.81.
- The readings add up to 78.48, so x̄ = 78.48 ÷ 8 = 9.81.
- The deviations from 9.81 are 0, −0.02, 0.03, −0.01, 0.01, −0.03, 0.02 and 0. Their squares sum to 0.0028, and 0.0028 ÷ 7 = 0.0004, so s = 0.02.
- The standard uncertainty is u = 0.02 ÷ √8 = 0.00707.
- With k = 2, U = 0.0141, which rounds to 0.014.
g = 9.810 ± 0.014 m/s² (k = 2)
The mean is written to three decimal places to match the uncertainty. Switching the coverage factor to the Student t option uses t = 2.365 for 7 degrees of freedom and gives U = 0.017, a slightly wider interval that allows for estimating s from only eight readings.
How to read the result
"9.810 ± 0.014 m/s² with k = 2" says the true value of g, as far as random scatter is concerned, very probably lies between 9.796 and 9.824. Always state k (or the confidence level), because ± u and ± 2u are very different claims. The chart shows each reading with the mean and the band; a single reading far outside the band is worth checking before you trust the result.
A Type A uncertainty only covers random error. If the stopwatch runs fast, every reading is off in the same direction and no amount of repetition will reveal it. Systematic effects need their own Type B estimates, added in quadrature.
How many readings are enough?
Because u falls with √n, going from 4 to 16 readings halves the standard uncertainty, and going from 16 to 64 halves it again. The returns shrink quickly, and past a point the Type A term is smaller than the resolution or calibration terms, so extra repeats buy nothing. Five to ten readings is a common compromise; with fewer than about six, use the t factor rather than k = 2.
Common mistakes
- Reporting s instead of s/√n. The standard deviation describes one reading; the mean is known more precisely.
- Dividing by n instead of n − 1 when finding s from a small set of readings.
- Quoting the uncertainty to five significant figures. Two is plenty; one is common in school labs.
- Forgetting the resolution when every reading is the same. Zero scatter does not mean zero uncertainty.
Common questions
What is the difference between Type A and Type B uncertainty?
The Guide to the Expression of Uncertainty in Measurement (GUM) sorts uncertainty components by how they are evaluated. Type A components are worked out statistically from repeated readings, as this calculator does. Type B components come from other information: an instrument's resolution, a calibration certificate, a manufacturer's specification. Both are expressed as standard deviations and are combined in quadrature.
Why divide the standard deviation by √n?
The standard deviation s describes the scatter of single readings. You report the mean, and the mean of n readings scatters less than one reading does, by a factor of √n. The standard uncertainty of the mean is therefore s/√n, the same quantity statisticians call the standard error.
Which coverage factor should I use?
k = 2 is the usual choice for reporting and gives roughly 95% coverage when the result is close to normally distributed. With only a handful of readings the t distribution is more honest: for 8 readings (7 degrees of freedom) the 95% factor is 2.36, and for 3 readings it is 4.30.
How do I include the resolution of my instrument?
Enter the smallest scale division in the optional resolution box. The calculator treats the reading as equally likely to be anywhere within ± half a division, a rectangular distribution with standard uncertainty r/(2√3), and combines it with the Type A term in quadrature.
Related calculators
-
Standard error calculator
The standard error of the mean from data or from s and n.
-
Error propagation calculator
Carry uncertainties through sums, products and formulas.
-
Confidence interval calculator
An interval for the population mean from sample data.