Shannon entropy calculator
Measure the uncertainty in a distribution. Enter probabilities, counts or a piece of text and the calculator gives the Shannon entropy with each −p log p term, the maximum possible entropy and how even the distribution is.
One count per category, e.g. individuals of each species.
Decimals or fractions such as 1/8; they must add up to 1.
Every character counts, including spaces; upper and lower case are different symbols.
| Category | Count | p | log₂ p | −p log₂ p |
|---|---|---|---|---|
| 1 | 40 | 0.4 | −1.3219 | 0.52877 |
| 2 | 25 | 0.25 | −2 | 0.5 |
| 3 | 20 | 0.2 | −2.3219 | 0.46439 |
| 4 | 10 | 0.1 | −3.3219 | 0.33219 |
| 5 | 5 | 0.05 | −4.3219 | 0.2161 |
Show the working, step by step
Turn each count into a proportion by dividing by the total.
p = n ÷ 100
Multiply each proportion by its log₂, add them and change the sign.
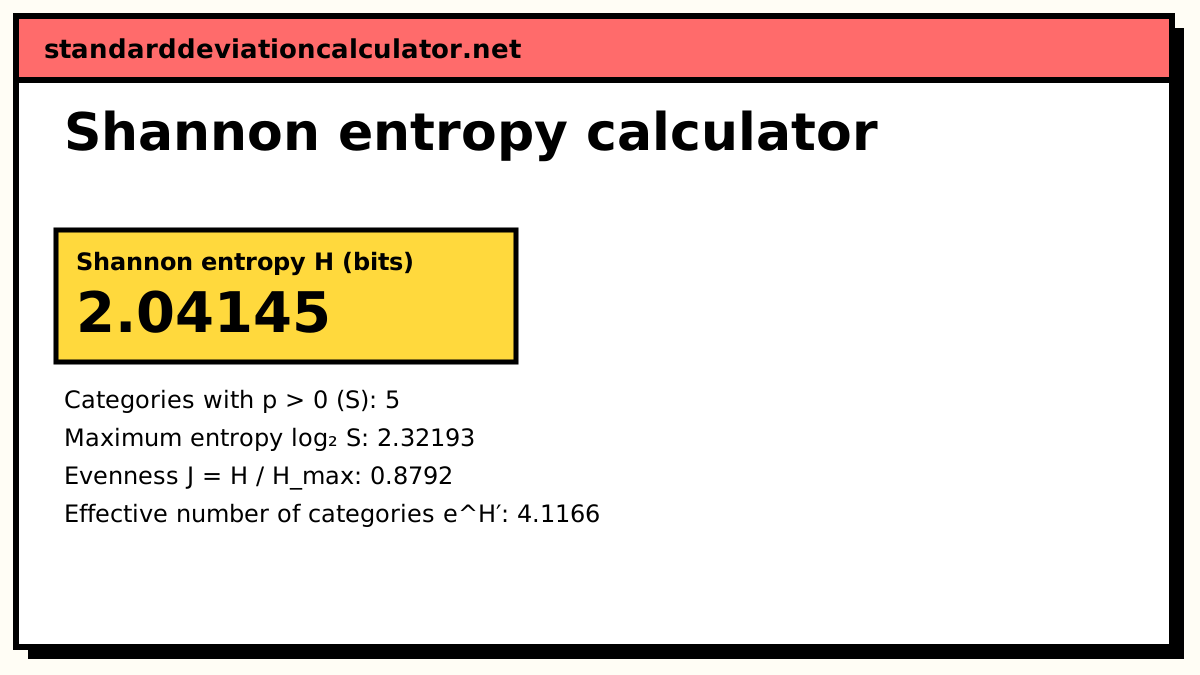
H = −Σ p log₂ p H = −(0.4·log₂(0.4) + 0.25·log₂(0.25) + 0.2·log₂(0.2) + 0.1·log₂(0.1) + 0.05·log₂(0.05)) H = 2.04145 bits
Compare with the maximum, reached when all S categories are equally likely.
H_max = log₂ 5 = 2.32193 J = 2.04145 ÷ 2.32193 = 0.8792
Categories with p = 0 add nothing, because p log p → 0 as p → 0. Ecologists usually report H′ with natural logs; information theory uses bits.
The formula
H = −Σ pᵢ log pᵢ H_max = log S J = H ÷ H_max
pᵢ is the probability (or proportion) of category i and S is the number of categories with pᵢ > 0. Categories with p = 0 contribute nothing, since p log p tends to 0. The base of the logarithm sets the unit.
A worked example from counts
The default is 100 observations in five categories with counts 40, 25, 20, 10 and 5, for example the individuals of five species in a sample. The proportions are 0.4, 0.25, 0.2, 0.1 and 0.05.
| p | log₂ p | −p log₂ p |
|---|---|---|
| 0.40 | −1.3219 | 0.5288 |
| 0.25 | −2.0000 | 0.5000 |
| 0.20 | −2.3219 | 0.4644 |
| 0.10 | −3.3219 | 0.3322 |
| 0.05 | −4.3219 | 0.2161 |
The terms add up to H = 2.041 bits. With five categories the maximum is log₂ 5 = 2.322 bits, so the evenness is 2.041 ÷ 2.322 = 0.879. In natural logs the same distribution has H′ = 1.415 nats, the figure an ecologist would report as the Shannon diversity index, and e^1.415 = 4.12 is the effective number of categories: the distribution is as uncertain as a fair choice among about 4.1 equally likely options.
Other inputs
With the probabilities 0.5, 0.25, 0.125 and 0.125 the entropy is exactly 1.75 bits, and a code that spends 1, 2, 3 and 3 bits on the four outcomes achieves that average length. In text mode each distinct character is a category. "hello world" has 11 characters, with l three times, o twice and the other six once each, giving 2.845 bits per character.
Interpreting the result
Higher entropy means outcomes are harder to predict. For a source of symbols, H in bits is a lower bound on the average code length per symbol when symbols are independent. For a community, higher H′ means more species, more evenly represented. Values of H′ in field studies commonly fall between about 1.5 and 3.5. Because H mixes richness and evenness, report S and J alongside it.
Entropy and sample size
The formula uses the observed proportions as if they were the true probabilities. With small samples this underestimates the entropy, because rare categories are often missed entirely. The Miller–Madow correction adds (S − 1) ÷ 2N nats to H′; for the default counts that is 4 ÷ 200 = 0.02 nats, negligible here but noticeable for samples of a few dozen.
Common mistakes
- Mixing log bases. Bits and nats differ by a factor of ln 2 = 0.693.
- Forgetting the minus sign, which gives a negative entropy.
- Entering probabilities that do not sum to 1. The calculator rejects totals far from 1 and rescales small rounding gaps.
- Comparing H′ across samples of very different sizes. Small samples miss rare categories and understate entropy.
Common questions
What does Shannon entropy measure?
The average uncertainty, or surprise, in the outcome of a random variable. In information theory it is the average number of bits needed per symbol to encode messages from that source. In ecology the same formula, usually with natural logs, is the Shannon diversity index H′.
What is the difference between bits, nats and dits?
Only the base of the logarithm. Base 2 gives bits, base e gives nats and base 10 gives dits (also called hartleys or bans). To convert, 1 nat = 1.4427 bits and 1 dit = 3.3219 bits.
What is the maximum possible entropy?
log S, reached when all S categories are equally likely. A fair coin has 1 bit, a fair six-sided die log₂ 6 = 2.585 bits. Any imbalance lowers the entropy; a certain outcome has entropy 0.
What is Pielou evenness?
J = H ÷ log S, the entropy as a fraction of its maximum. It runs from 0 to 1 and does not depend on the log base. Ecologists use it to separate how many species there are from how evenly the individuals are spread among them.
Is the Shannon index the same as Simpson’s index?
No. Both measure diversity, but Shannon's H′ gives more weight to rare species and Simpson's index is dominated by the common ones. They often rank communities the same way, but not always.
Related calculators
-
Simpson's diversity index calculator
D, 1 − D and 1/D from species counts.
-
Probability calculator
Union, intersection and complement of two events.
-
Relative standard error calculator
How precise an estimate is, as a percentage.