Simpson's diversity index calculator
Enter the number of individuals of each species in your sample and the calculator gives Simpson's index D, the index of diversity 1 − D and the reciprocal index 1/D, with the working laid out the way exam mark schemes expect.
| Species | n | p = n/N | n(n − 1) |
|---|---|---|---|
| Buttercup | 12 | 0.4 | 132 |
| Daisy | 8 | 0.2667 | 56 |
| Clover | 5 | 0.1667 | 20 |
| Dandelion | 3 | 0.1 | 6 |
| Plantain | 2 | 0.06667 | 2 |
| Total | 30 | 1 | 216 |
Show the working, step by step
Add up the individuals.
N = 12 + 8 + 5 + 3 + 2 = 30
For each species work out n(n − 1), then add them.
Σn(n − 1) = 12×11 + 8×7 + 5×4 + 3×2 + 2×1 = 216
Divide by N(N − 1).
D = 216 ÷ (30 × 29) = 216 ÷ 870 = 0.248276
Subtract from 1 for the index of diversity, and invert for the reciprocal.
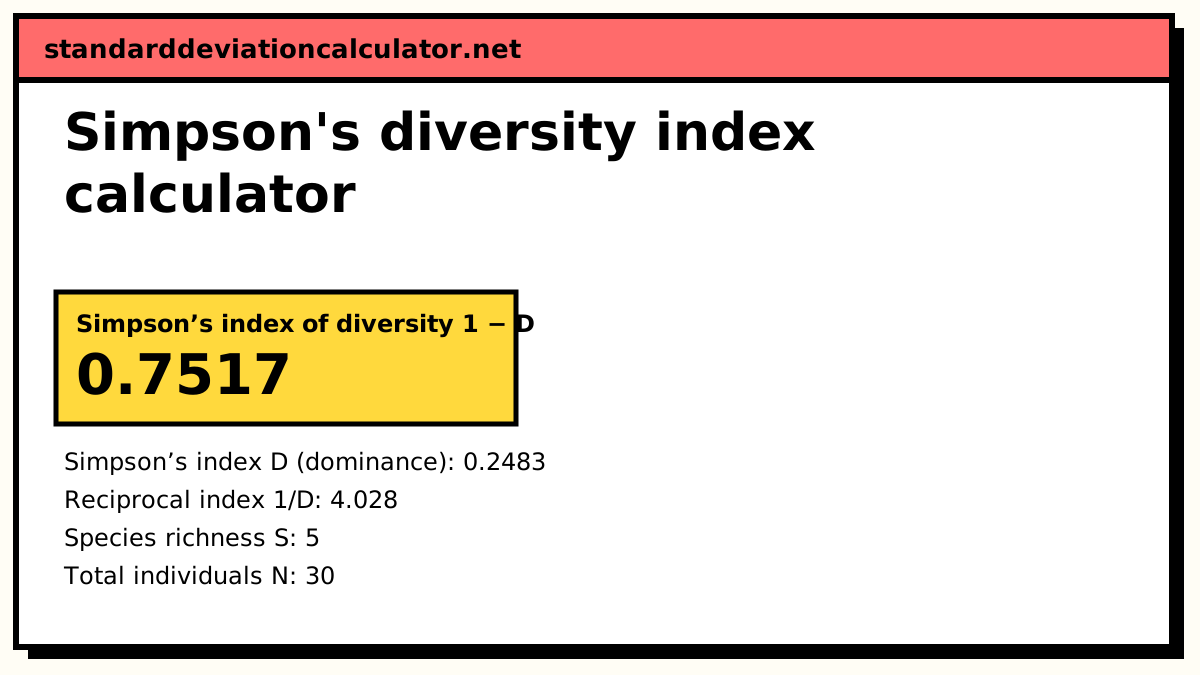
1 − D = 0.7517 1/D = 4.028
1 − D is the probability that two individuals picked at random (without replacement, in the n(n − 1) form) belong to different species. It runs from 0 (one species) towards 1 (many equally common species).
The formula
D = Σ n(n − 1) ÷ N(N − 1) index of diversity = 1 − D reciprocal index = 1 ÷ D
n is the number of individuals of one species and N the total number of individuals of all species. With proportions p = n/N, the infinite-population version is D = Σp².
A worked example
The default is a meadow quadrat with 12 buttercups, 8 daisies, 5 clover, 3 dandelions and 2 plantains, so N = 30.
| Species | n | n(n − 1) |
|---|---|---|
| Buttercup | 12 | 132 |
| Daisy | 8 | 56 |
| Clover | 5 | 20 |
| Dandelion | 3 | 6 |
| Plantain | 2 | 2 |
| Total | 30 | 216 |
D = 216 ÷ (30 × 29) = 216 ÷ 870 = 0.2483 1 − D = 0.7517 1 ÷ D = 4.03
Two plants picked at random from this quadrat have a 75% chance of being different species. The reciprocal index says the community is as diverse as one with about 4 equally common species, even though 5 species are present, because buttercups dominate. With the Σp² form the same counts give D = 0.2733 and 1 − D = 0.7267; the finite-sample form is higher because it accounts for not picking the same individual twice.
Interpreting the index
1 − D runs from 0, when every individual is the same species, towards 1 as the number of species grows and their abundances even out. Values above about 0.7 usually indicate a diverse community, but the index is most useful for comparison: the same method, quadrat size and effort at two sites, or at one site over time. A mown lawn dominated by grass might score 0.2; a hay meadow with many flowering species 0.8 or more.
Simpson's index is weighted towards the common species. Adding one individual of a rare species barely changes it, which makes it robust to sampling effort but less sensitive to rare species than the Shannon index.
Collecting the counts
Count every individual of every species inside the sample area, and use the same quadrat size and number of quadrats at each site you compare. For plants that are hard to count as individuals, such as grasses, percentage cover is sometimes used in place of n; the p² form then applies, with p as each species' share of the total cover.
Common mistakes
- Reporting D and calling it diversity. D is dominance; diversity is 1 − D or 1/D.
- Using N² instead of N(N − 1) in the n(n − 1) form, or mixing the two forms.
- Forgetting that a species with one individual contributes 1 × 0 = 0 to Σn(n − 1), but still counts towards N.
- Comparing sites sampled with different quadrat sizes or effort.
Common questions
What is Simpson's diversity index?
A measure of biodiversity that accounts for both how many species there are and how evenly the individuals are spread among them. D is the probability that two individuals picked at random belong to the same species; 1 − D, Simpson's index of diversity, is the probability they belong to different species.
Is a high or low value more diverse?
It depends which version you quote, which is why it causes confusion. A high 1 − D or a high 1/D means high diversity. A high D means low diversity, because D measures dominance. Always say which one you report.
Which formula should I use: n(n − 1) or p²?
Most biology courses and field guides use Σn(n − 1) ÷ N(N − 1), which is Simpson's original form for a finite sample drawn without replacement. Σp² is the form for an infinite population and is slightly larger. The two converge as the sample grows.
What does the reciprocal index 1/D mean?
The number of equally common species that would give the same D. Its minimum is 1 (one species) and its maximum is the number of species S, reached when all are equally abundant.
Related calculators
-
Quiz: Simpson's diversity index
Practise 1 − D on random quadrat data, with answers.
-
Shannon entropy calculator
The Shannon diversity index H′ and evenness.
-
Mean calculator
The average of a list of numbers, with the working.