Mean absolute deviation calculator
The mean absolute deviation (MAD) is the average distance from the mean, without squaring. Enter your numbers to get it about both the mean and the median, alongside the standard deviation for comparison.
Separate numbers with commas, spaces or new lines, or paste a spreadsheet column.
Decimals and negatives are fine; write 10:3 for a value that occurs 3 times.
Your results will appear here: the result first, then the rest of the summary and a chart.
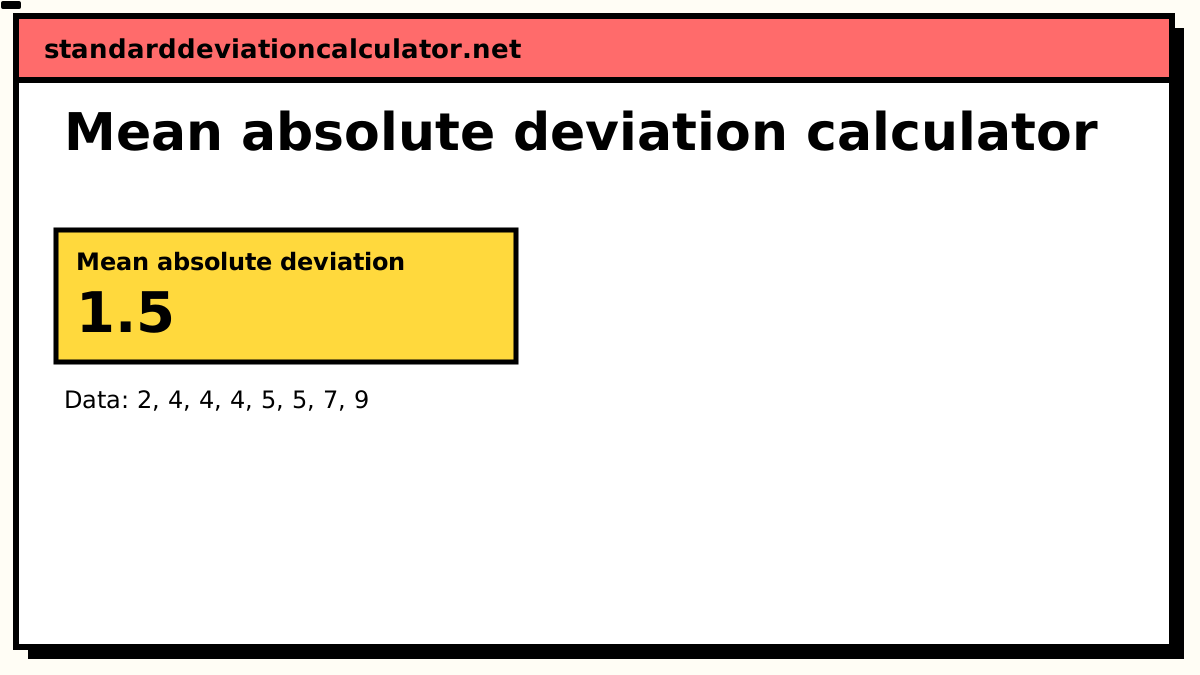
Mean absolute deviation
1.5
Data distribution
Shaded bands mark ±1, ±2 and ±3 SD from the mean. 6 of 8 values (75%) fall within ±1 SD.
Chart as text
Mean 5, sample standard deviation s = 2.13809, from 8 values between 2 and 9.
- Within ±1 SD (2.862 to 7.138): 6 of 8 values (75%). About 68% for normal data.
- Within ±2 SD: 8 (100%). About 95% for normal data.
- Within ±3 SD: 8 (100%). About 99.7% for normal data.
Show the working, step by step
Mean absolute deviation formula
MAD = Σ|x − x̄| / n
Find the mean, take the distance of each value from it, drop the minus signs, and average. That is the whole calculation, noticeably simpler than the standard deviation formula, and the reason MAD is often taught first.
Why the standard deviation won anyway
MAD is easier to compute and easier to explain, so its near-total absence from statistical practice needs an explanation. Three reasons:
- Variances add; mean absolute deviations do not. For independent quantities, Var(X + Y) = Var(X) + Var(Y). No comparable rule exists for MAD, which means no ANOVA, no variance decomposition, no portfolio mathematics.
- The absolute value is not differentiable at zero. Squared error can be minimised with calculus, which is what makes least-squares regression tractable.
- For normal data, the SD is the more efficient estimator. It extracts more information from the same sample.
The trade-off runs the other way when outliers are present, which is why MAD retains a place in forecasting and robust statistics.
Mean absolute deviation: a worked example
Data: 2, 4, 4, 4, 5, 5, 7, 9. The mean is 5.
| x | x − x̄ | |x − x̄| | (x − x̄)² |
|---|---|---|---|
| 2 | −3 | 3 | 9 |
| 4 | −1 | 1 | 1 |
| 4 | −1 | 1 | 1 |
| 4 | −1 | 1 | 1 |
| 5 | 0 | 0 | 0 |
| 5 | 0 | 0 | 0 |
| 7 | 2 | 2 | 4 |
| 9 | 4 | 4 | 16 |
| Σ | 0 | 12 | 32 |
MAD = 12 ÷ 8 = 1.5. The population standard deviation is √(32 ÷ 8) = 2. Both describe the same data; the SD is larger because the value at 9, four units out, contributed 16 to the squared column but only 4 to the absolute one.
Note the middle column summing to exactly zero. That is why some way of removing the signs (absolute values or squares) is unavoidable.
The ratio between them
For normally distributed data the two settle into a fixed relationship:
MAD ≈ 0.7979 × σ, or σ ≈ 1.2533 × MAD. The calculator reports the MAD ÷ SD
ratio for your own data, and a value far from 0.8 is a useful hint that your data is not
normal, usually because outliers are inflating the standard deviation.
One naming trap: MAD also stands for the median absolute deviation, the median of |x − median|, which is a different and more outlier-resistant number. The median absolute deviation calculator works that one out, with its 1.4826 scaling to estimate σ.
For the range, IQR, variance, skewness and outliers, see the spread, shape and outlier calculators.
Related calculators
-
Standard deviation
The squared-deviation counterpart, and the default choice.
-
Variance calculator
Why squaring is what makes spread additive.
-
IQR & outliers
A fully rank-based measure of spread.
-
The SD formula
Why the deviations get squared in the first place.
Common questions
What is the mean absolute deviation?
The average distance of each value from the mean, using absolute values rather than
squares: MAD = Σ|x − x̄| / n. Like the standard deviation it measures spread,
and it is in the same units as the data.
What is the difference between MAD and standard deviation?
Both stop deviations cancelling out, but by different means. MAD takes absolute values; the SD squares them, then square-roots at the end.
Squaring makes the SD weight far-out values much more heavily: a point twice as far from the mean contributes four times as much, not twice. So the SD is always the larger of the two, and the gap widens the more outliers you have.
Which should I use?
The standard deviation for almost anything feeding into further statistics (confidence intervals, t-tests, regression) because variances add and mean absolute deviations do not.
MAD when you want a plain, honest "average distance from the middle" that is easier to explain and less swayed by a single extreme value. It is also common in forecasting, where mean absolute error is the standard accuracy measure.
Should I measure deviations from the mean or the median?
From the mean by default, which is what "mean absolute deviation" normally means. The median version is always smaller (deviations about the median are mathematically minimal) and is more robust to outliers. This calculator reports both.
Is MAD the same as median absolute deviation?
No, and the shared abbreviation causes real confusion. Mean absolute deviation averages the distances. Median absolute deviation takes the median of them, and is a different, more robust statistic used for outlier detection.