Statistics
Coefficient of range calculator
The range is the gap between the largest and smallest values; the coefficient of range turns it into a unit-free ratio. Enter a list, an (x, f) table or class intervals.
Separate with commas, spaces or new lines.
Exclusive classes (10-20, 20-30) or inclusive classes (10-19, 20-29). Inclusive classes are converted to class boundaries.
Show the working, step by step
Find the largest (L) and smallest (S) values.
L = 90, S = 38
Range = L − S.
90 − 38 = 52
Coefficient of range = (L − S)/(L + S).
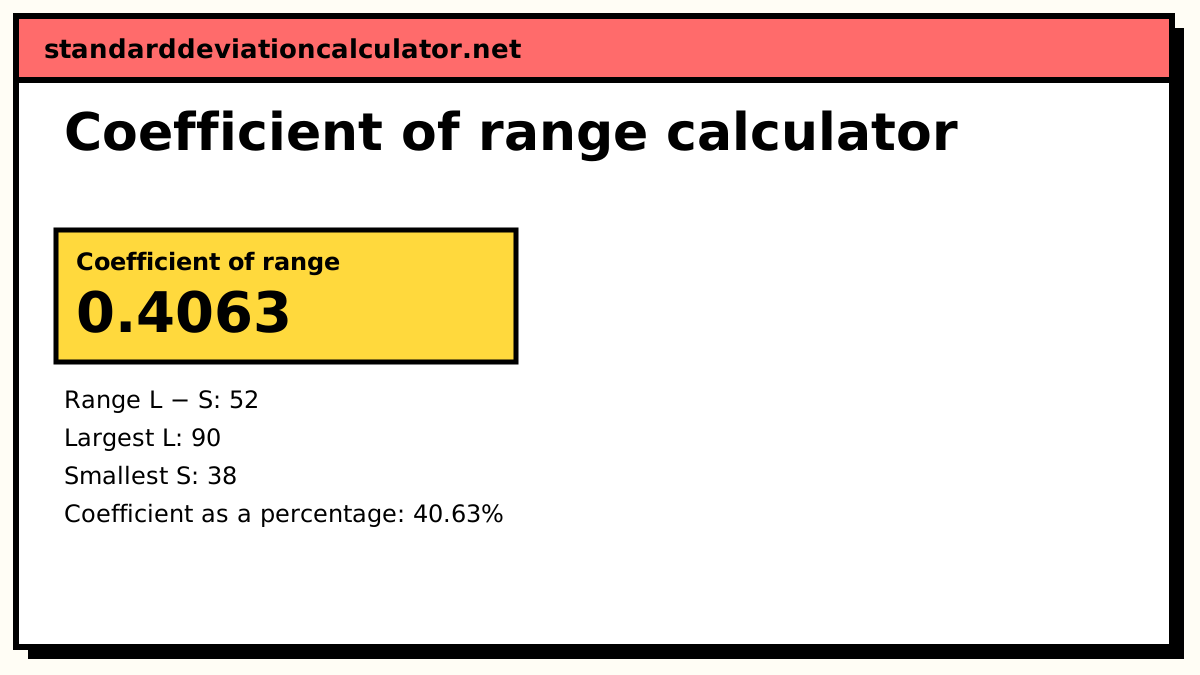
(90 − 38)/(90 + 38) = 52/128 = 0.4063
The range is in the units of the data; the coefficient has no units, so it can compare series measured in different units or on different scales.
The formulas
Range = L − S Coefficient of range = (L − S) / (L + S)
L is the largest value and S the smallest. In a discrete series they are the largest and smallest values of x that occur; the frequencies do not matter. In a continuous series, L is the upper limit of the highest class and S the lower limit of the lowest class.
Worked example: individual series
The default data are eight test marks: 45, 62, 38, 71, 55, 90, 48, 66.
- Largest L = 90, smallest S = 38.
- Range = 90 − 38 = 52 marks.
- Coefficient of range = (90 − 38)/(90 + 38) = 52/128 = 0.4063, or 40.63%.
Worked example: grouped data
Switch to a continuous series to load classes 10-20, 20-30, 30-40, 40-50 and 50-60 with frequencies 4, 9, 15, 8 and 4. L is the upper limit of 50-60, which is 60, and S the lower limit of 10-20, which is 10. The range is 50 and the coefficient is 50/70 = 0.7143.
With inclusive classes such as 10-19, …, 50-59, the textbook rule uses the limits as written: L = 59, S = 10, range 49 and coefficient 49/69 = 0.7101. Some books use the class boundaries 9.5 and 59.5 instead, which gives a range of 50 and a coefficient of 50/69 = 0.7246. The calculator shows the limit version and prints the boundary version under the working.
Comparing two series
Suppose daily wages in factory A run from ₹400 to ₹900 and in factory B from ₹250 to ₹600. A's range (₹500) is larger than B's (₹350), but the coefficients are 500/1,300 = 0.385 and 350/850 = 0.412, so B's wages are relatively more spread out. This is what the coefficient is for: comparing spread after allowing for the size of the values.
When the range is (and is not) a good measure
| Good for | Poor for |
|---|---|
| Quick checks, quality control charts, daily price or temperature swings | Data with outliers, since one extreme value sets L or S |
| Small samples of similar size | Comparing samples of different sizes; larger samples tend to have larger ranges |
| Explaining spread to a general audience | Open-ended classes such as “60 and above” |
For a measure that ignores the extremes, use the quartile deviation; for one that uses every value, the mean deviation or the standard deviation.
Common mistakes
- Using the first and last numbers as typed instead of the largest and smallest.
- In grouped data, subtracting the midpoints or the frequencies instead of the class limits.
- Applying the coefficient to data with negative values, where L + S can be zero or negative and the ratio stops making sense.
Common questions
What is the formula for coefficient of range?
Coefficient of range = (L − S) / (L + S), where L is the largest value and S
the smallest. The range itself is L − S. For 45, 62, 38, 71, 55, 90, 48, 66 that is
(90 − 38)/(90 + 38) = 52/128 = 0.4063.
How do you find the range of grouped data?
Take L as the upper limit of the highest class and S as the lower limit of the lowest class. For classes 10-20 up to 50-60, the range is 60 − 10 = 50 and the coefficient is 50/70 = 0.7143. Some books use class boundaries for inclusive classes, or the midpoints of the extreme classes; the calculator notes the boundary version when it differs.
Why calculate a coefficient instead of just the range?
The range is in the units of the data, so a range of ₹5,000 in monthly wages and a range of 12 cm in heights cannot be compared. The coefficient is a pure number, so it can compare the relative spread of series in different units or with different sizes.
Can the coefficient of range be expressed as a percentage?
Yes, multiply by 100. A coefficient of 0.4063 is 40.63%. For positive data it always lies between 0 (every value the same) and 1 (the smallest value is 0).
What are the limitations of the range?
It uses only the two most extreme values, so one unusual observation changes it completely, and it tends to grow as you collect more data. It cannot be found for open-ended classes. The quartile deviation and the standard deviation avoid these problems, at the cost of more calculation.
Related calculators
-
Range calculator
Range, minimum and maximum of a list.
-
Quartile deviation
Spread of the middle half, and its coefficient.
-
Mean deviation
Average distance from the mean, median or mode.
-
Coefficient of variation
Standard deviation relative to the mean.