Stock beta calculator
Beta measures how much a stock tends to move when the market moves. Enter the stock’s and the market index’s returns for the same periods, or their prices, and the calculator works out beta as covariance over variance, together with alpha, R² and the correlation.
Paste two columns from a spreadsheet. Prices are turned into simple returns first, so n prices give n − 1 returns.
| t | Rs | Rm | Rm − R̄m | Rs − R̄s | (Rm − R̄m)(Rs − R̄s) | (Rm − R̄m)² |
|---|---|---|---|---|---|---|
| 1 | 2% | 1% | 0.6% | 1% | 0.6 | 0.36 |
| 2 | −1% | −2% | −2.4% | −2% | 4.8 | 5.76 |
| 3 | 4% | 3% | 2.6% | 3% | 7.8 | 6.76 |
| 4 | 3% | 1% | 0.6% | 2% | 1.2 | 0.36 |
| 5 | −3% | −1% | −1.4% | −4% | 5.6 | 1.96 |
| Σ | 0 | 0 | 20 | 15.2 |
Show the working, step by step
Average each return series.
R̄s = 1%, R̄m = 0.4%
Sample covariance: sum the products of deviations and divide by n − 1.
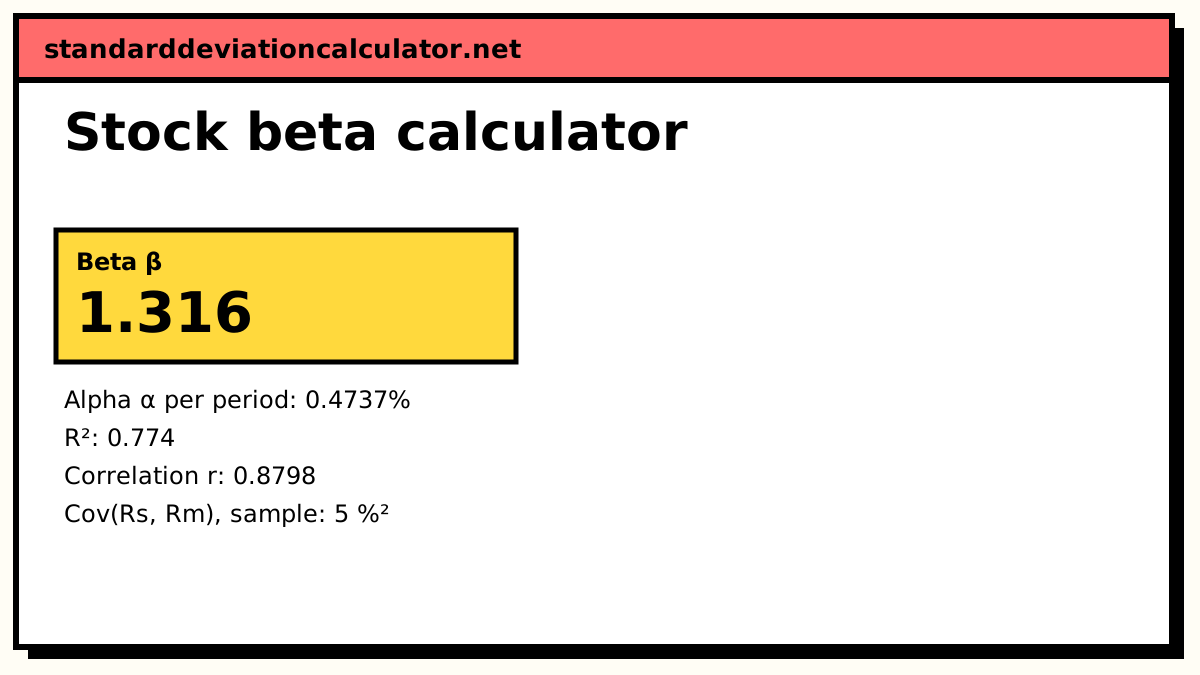
Cov = 20 ÷ 4 = 5 %²
Sample variance of the market: sum its squared deviations and divide by n − 1.
Var = 15.2 ÷ 4 = 3.8 %²
Beta is the covariance over the market variance (the n − 1 cancels).
β = 5 ÷ 3.8 = 1.316
Alpha is the intercept of the regression line.
α = R̄s − βR̄m = 1% − 1.316 × 0.4% = 0.4737%
R² is the square of the correlation: the share of the stock’s variance the market explains.
r = 0.8798, R² = 0.774
This is the historical (raw) beta from ordinary least squares. It changes with the window, the return frequency and the index you use as the market.
Using the stock beta calculator
Put one period per row: the stock in the first column, the market index (for example the S&P 500) in the second. Choose whether the columns hold returns in percent or prices. Prices are turned into simple returns, Rt = Pt ÷ Pt−1 − 1, so the first row of prices only serves as the starting point. Both columns must cover the same dates; a missing value in either column is an error rather than a silent skip, because a shifted row would pair the wrong returns.
The calculator reports four numbers:
- β, the slope: the average stock return per 1% market return.
- α, the intercept: the average stock return when the market return is 0.
- R², the share of the variance in the stock’s returns explained by the market.
- r, the correlation between the two return series.
The beta formula
β = Cov(Rs, Rm) ÷ Var(Rm) α = R̄s − β × R̄m
Rs and Rm are the stock and market returns. The covariance measures how the two move together; dividing by the variance of the market rescales it to “per unit of market movement”. Beta is the sensitivity that appears in the capital asset pricing model of Sharpe (Journal of Finance, 1964).
Beta as a regression slope
The same ratio is the least-squares slope of the line Rs = α + βRm. Paste the two columns into the linear regression calculator with the market as x and the stock as y and you get the same β as the slope, α as the intercept and the same R². In a simple regression R² equals the square of the correlation r.
Worked example: five periods by hand
The calculator starts with five periods of returns (%):
| t | Stock Rs | Market Rm | Rm − R̄m | Rs − R̄s | Product | (Rm − R̄m)² |
|---|---|---|---|---|---|---|
| 1 | 2 | 1 | 0.6 | 1 | 0.6 | 0.36 |
| 2 | −1 | −2 | −2.4 | −2 | 4.8 | 5.76 |
| 3 | 4 | 3 | 2.6 | 3 | 7.8 | 6.76 |
| 4 | 3 | 1 | 0.6 | 2 | 1.2 | 0.36 |
| 5 | −3 | −1 | −1.4 | −4 | 5.6 | 1.96 |
| Σ | 5 | 2 | 0 | 0 | 20 | 15.2 |
- Means: R̄s = 5 ÷ 5 = 1%, R̄m = 2 ÷ 5 = 0.4%.
- Sample covariance: 20 ÷ 4 = 5 (%²).
- Sample variance of the market: 15.2 ÷ 4 = 3.8 (%²).
- β = 5 ÷ 3.8 = 1.316. The n − 1 cancels, so 20 ÷ 15.2 gives the same answer.
- α = 1 − 1.316 × 0.4 = 0.4737% per period.
- The stock’s squared deviations sum to 34, so r = 20 ÷ √(15.2 × 34) = 0.8798 and R² = 0.774.
About 77% of the variation in this stock’s returns lines up with the market; the remaining 23% is specific to the stock.
Reading beta
- β = 1: the stock moved one-for-one with the index on average.
- β above 1: it amplified market moves, up and down. Many technology and small company stocks sit here.
- β between 0 and 1: it moved in the same direction but less, as utilities and consumer staples often do.
- Negative β: it tended to move against the market. Inverse index funds are built to do this; a few assets, such as gold over some windows, have shown it.
Always read beta alongside R². A beta of 1.3 with an R² of 0.05 says the market explains almost none of the stock’s movement, and the beta estimate itself is unreliable.
Choices that change beta
- Window length. A longer window gives a steadier estimate but may include a business the company no longer runs. Two to five years is common.
- Return frequency. Daily, weekly and monthly returns can give noticeably different betas, especially for thinly traded stocks whose prices react to the market with a lag.
- Index choice. Beta is relative to the index you enter. A stock’s beta against a broad national index and against a sector index answer different questions.
For total risk rather than market sensitivity, see the volatility calculator and the guide to standard deviation in finance.
Common questions
What is the formula for beta?
β = Cov(Rs, Rm) ÷ Var(Rm): the covariance of the stock’s returns with the
market’s returns, divided by the variance of the market’s returns. It is also the slope of the
least-squares line when stock returns are regressed on market returns.
Should I enter prices or returns?
Either. Prices are converted to simple returns, Pₜ ÷ Pₜ₋₁ − 1, before anything else, so six prices give five returns. Beta must be estimated from returns: regressing one price series on another measures how the price levels trend together, not how the stock reacts to market moves.
Does it matter whether I use sample or population covariance?
No, as long as the covariance and the variance use the same divisor. Both are divided by n − 1 here, and the n − 1 cancels in the ratio. Mixing a sample covariance with a population variance would inflate beta by n ÷ (n − 1).
What does a beta of 1.3 mean?
Over the sample, the stock moved on average 1.3% for each 1% move in the market. It does not mean the stock is 30% riskier overall: beta only captures the part of the risk that comes with the market. R² tells you how much of the stock’s variance that part is.
Why does my beta differ from the one on a finance website?
Published betas use a particular window (often 2 or 5 years), return frequency (daily, weekly or monthly) and index, and some are adjusted toward 1. Change any of these and the estimate moves. Match the choices before comparing numbers.
Related calculators
-
Covariance calculator
The Cov(Rs, Rm) step on its own, sample and population.
-
Linear regression
Beta is the slope of this line; alpha is the intercept.
-
Correlation coefficient
The r behind R², from paired data.
-
Sharpe ratio calculator
Excess return per unit of total risk.