Diagnostic test and risk calculators
Calculators for judging how well a test or classifier performs and for comparing risk between groups. They are built for clinicians, epidemiology students and data scientists working from a 2×2 table of results or from published sensitivity, specificity and event rates.
Which calculator do I need?
| You have or want | Use |
|---|---|
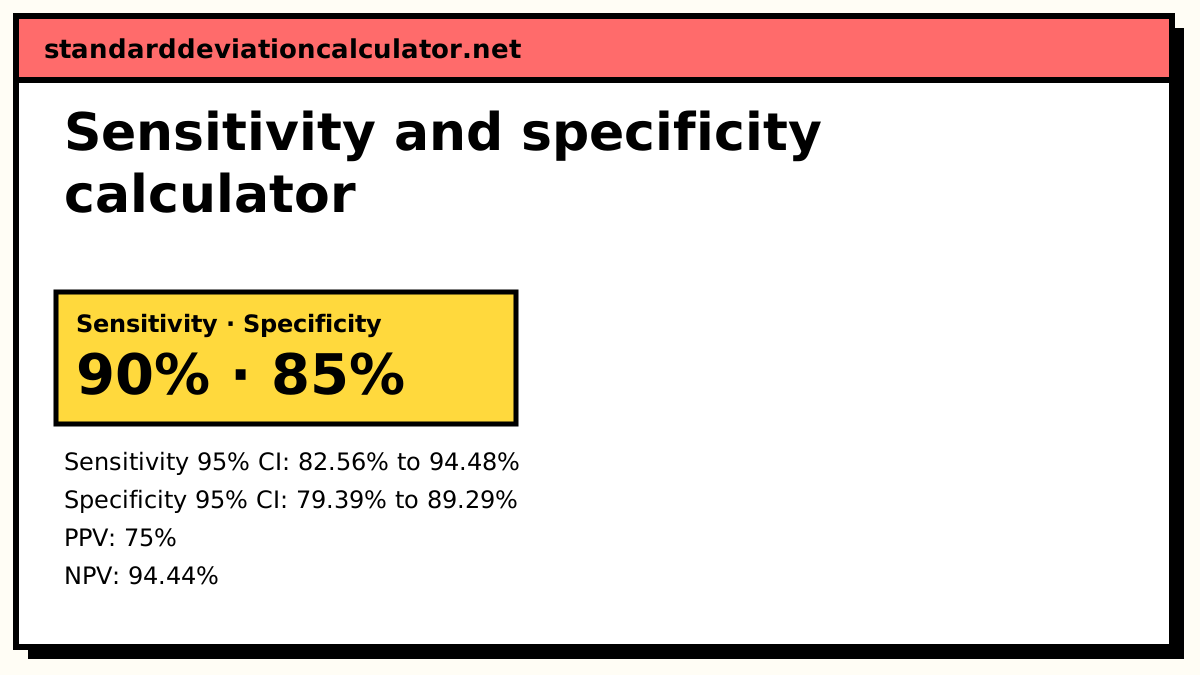
| TP, FP, FN and TN counts, and want sensitivity, specificity, PPV and NPV with CIs | Sensitivity and specificity calculator |
| A classifier’s confusion matrix, and want precision, recall, F1 or MCC | Confusion matrix calculator |
| A pre-test probability and a likelihood ratio | Post-test probability calculator |
| To see why a positive result for a rare condition is often false | False positive paradox calculator |
| The best cut-off from a table of thresholds | Youden index calculator |
| Event counts in exposed and unexposed groups, and want RR with a CI | Relative risk calculator |
| Treatment and control event rates, and want ARR, RRR, odds ratio and NNT | Risk calculator |
Test accuracy from a 2×2 table
Summarise how often a test or classifier gets positives and negatives right.
-
Sensitivity and specificity calculator
Sensitivity, specificity, PPV, NPV and likelihood ratios with Wilson or exact confidence intervals.
-
Confusion matrix calculator
Accuracy, precision, recall, F1, MCC, kappa and more from a 2×2 confusion matrix.
-
Accuracy calculator
Accuracy from TP/TN/FP/FN or from sensitivity and specificity, and percent accuracy of a measurement.
-
Youden index calculator
Youden's J from a 2×2 table, or the best cut-off from a table of thresholds.
From a test result to a probability
Turn a test’s accuracy and the base rate into the chance that a given result is right.
-
Post-test probability calculator
Pre-test probability and a likelihood ratio to post-test probability, drawn on a Fagan nomogram.
-
False positive paradox calculator
Why an accurate test gives mostly false positives for a rare condition, with a frequency tree.
-
Bayes' theorem calculator
Posterior probability for a medical test, with natural frequencies, or across several hypotheses.
Comparing risk between groups
Measure how much an exposure or treatment changes the chance of an outcome.
-
Relative risk calculator
Relative risk with a 95% confidence interval, the risk difference and NNT or NNH.
-
Risk calculator
Absolute and relative risk, risk reduction, attributable risk, odds ratio and NNT from two groups.
Accuracy of the test vs meaning of the result
Sensitivity and specificity describe the test: the share of people with the condition who test positive, and the share without it who test negative. They do not change with prevalence. Positive and negative predictive values describe the result: the chance that a positive or negative is correct, and they depend heavily on how common the condition is. The sensitivity and specificity calculator gives all four from a 2×2 table; the post-test probability calculator and Bayes’ theorem calculator apply them to a patient with a given pre-test probability.
Worked example: a good test for a rare condition
A test has 99% sensitivity and 95% specificity, and 1% of people screened have the condition. Out of 10,000 people, 100 have it and 99 test positive; of the 9,900 without it, 5% or 495 test positive. So only 99 of 594 positives are true: PPV = 16.7%. The same answer comes from likelihood ratios: LR+ = 0.99 / 0.05 = 19.8, pre-test odds 1 : 99, post-test odds 0.2, probability 0.2 / 1.2 = 16.7%. Youden’s J for this test is 0.99 + 0.95 − 1 = 0.94. The false positive paradox calculator draws this as a frequency tree.
Relative and absolute risk
If 20 of 100 exposed people and 10 of 100 unexposed people develop an outcome, the relative risk is 0.20 / 0.10 = 2.0, the risk difference is 10 percentage points, and the number needed to harm is 1 / 0.10 = 10. The odds ratio from the risk calculator is (20/80) / (10/90) = 2.25: larger than the relative risk, as it always is when the outcome is common.
Common mix-ups
- Accuracy on imbalanced data. A classifier that always says “negative” is 99% accurate when 1% are positive. Use balanced accuracy, F1 or MCC from the confusion matrix calculator.
- Recall and sensitivity are the same thing, and precision is the PPV; the names differ between medicine and machine learning.
- Odds ratio vs relative risk. They are close only when the outcome is rare, below about 10%.