Relative risk calculator
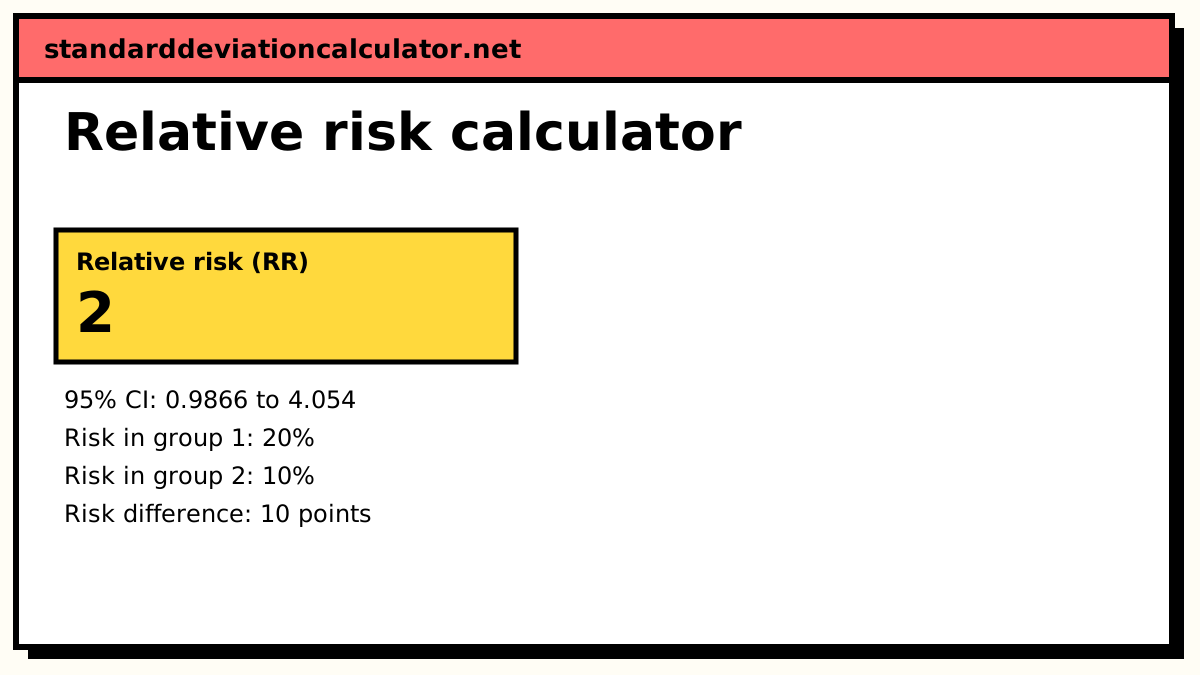
Enter the events and group sizes for an exposed and an unexposed group. The calculator gives the relative risk with its confidence interval, the risk difference and the number needed to treat or harm.
Event No event
The relative risk compares the event shares of the two bars: 20% ÷ 10% = 2.
| Events | No event | Total | Risk | |
|---|---|---|---|---|
| Group 1 (exposed) | 20 | 80 | 100 | 20% |
| Group 2 (unexposed) | 10 | 90 | 100 | 10% |
| Total | 30 | 170 | 200 | 15% |
Show the working, step by step
Risk in each group is events ÷ group size.
R₁ = 20 ÷ 100 = 0.2 R₀ = 10 ÷ 100 = 0.1
The relative risk is their ratio.
RR = 0.2 ÷ 0.1 = 2
The interval is built on the log scale, where RR is close to normal.
SE(ln RR) = √(1/a − 1/n₁ + 1/c − 1/n₀) = √(1/20 − 1/100 + 1/10 − 1/100) = 0.360555 ln RR = 0.693147, z = 1.95996 CI = exp(0.693147 ± 1.95996 × 0.360555) = 0.986563 to 4.05448
Risk difference and the number needed to treat (or harm).
RD = 0.2 − 0.1 = 0.1 NNT = 1 ÷ |RD| = 10
The 95% CI includes 1, so at the 5% level the data are consistent with no difference in risk.
The formula
RR = (a ÷ n₁) ÷ (c ÷ n₀) SE(ln RR) = √(1/a − 1/n₁ + 1/c − 1/n₀) 95% CI = exp(ln RR ± 1.96 × SE)
Here a is the number of events among the n₁ people in group 1 (exposed or treated), and c the number among the n₀ people in group 2 (unexposed or control).
Worked example
The default: 20 of 100 exposed people develop the outcome, against 10 of 100 unexposed people.
- Risks: R₁ = 20 ÷ 100 = 0.2 and R₀ = 10 ÷ 100 = 0.1.
- RR = 0.2 ÷ 0.1 = 2. The outcome is twice as likely with exposure.
- SE(ln RR) = √(1/20 − 1/100 + 1/10 − 1/100) = √0.13 = 0.3606.
- ln 2 = 0.6931, so the limits are exp(0.6931 ± 1.96 × 0.3606) = exp(−0.0136) to exp(1.3999) = 0.987 to 4.05.
- Risk difference = 0.1 (10 percentage points), 95% CI 0.2 to 19.8 points; NNH = 1 ÷ 0.1 = 10.
- z = 0.6931 ÷ 0.3606 = 1.92, two-sided p = 0.055.
The RR interval just includes 1, while the risk-difference interval just excludes 0. The two methods make different approximations and disagree at the margin. With a p-value this close to 0.05, the fair summary is that the data suggest a doubling of risk but are not conclusive; a larger study would settle it.
How to interpret relative risk
RR tells you how strong the association is in proportional terms, but not how much it matters. A doubling of a 1-in-100,000 risk adds one case per 100,000 people; a doubling of a 10% risk adds one case per 10. Always report the absolute risks or the risk difference alongside RR. The number needed to harm of 10 here means that, on average, one extra person develops the outcome for every ten exposed.
An RR from an observational study describes association, not cause. Confounding factors that differ between the groups can produce or hide an effect.
Changing the confidence level
At 90% confidence the multiplier drops from 1.96 to 1.645 and the RR interval for the default data narrows to about 1.11 to 3.62, which excludes 1. At 99% it widens to about 0.79 to 5.06. The estimate of 2 does not change; only the stated precision does.
Common mistakes
- Calculating RR from a case-control study. There the group sizes are set by the design, so risks cannot be estimated; use the odds ratio.
- Swapping the groups. RR = 2 with the exposed group on top becomes RR = 0.5 the other way round. Check which group is group 1.
- Reading "risk increased by 100%" as "risk went up by 100 percentage points". A relative increase of 100% took the risk from 10% to 20% here.
- Reporting RR without its confidence interval. The interval shows how precise the estimate is.
Common questions
What is relative risk?
The ratio of the risk of an outcome in one group to the risk in another: RR = R₁ ÷ R₀, where each risk is events ÷ people in that group. RR = 2 means the outcome is twice as likely in group 1; RR = 0.5 means half as likely; RR = 1 means no difference. It is also called the risk ratio.
How is the confidence interval for relative risk calculated?
On the log scale, where the sampling distribution is close to normal. SE(ln RR) = √(1/a − 1/n₁ + 1/c − 1/n₀), and the limits are exp(ln RR ± z × SE), with z = 1.96 for 95%. This is the method in most textbooks (often credited to Katz et al., 1978).
What is the difference between relative risk and odds ratio?
Relative risk divides probabilities; the odds ratio divides odds (events ÷ non-events). They are close when the outcome is rare, but the odds ratio is always further from 1 than the relative risk. Cohort studies and trials can report either; case-control studies can only estimate the odds ratio. The risk calculator gives both.
What is NNT or NNH?
The number needed to treat (or harm) is 1 ÷ |risk difference|: how many people must be exposed for one extra (or one fewer) event. With risks of 20% and 10%, the difference is 0.1 and the number is 10. It is conventionally rounded up to a whole person.
What if a group has zero events?
A zero in the comparison group makes RR infinite, and a zero anywhere makes the log-scale interval undefined. A common fix is to add 0.5 to every cell of the table before calculating (the Haldane–Anscombe correction). You can do that by entering, say, 0.5 events out of 100.5.
Related calculators
-
Risk calculator
Absolute risk, RRR, ARR, odds ratio and NNT together.
-
Chi-square calculator
Test whether a 2×2 table shows an association.
-
Confidence interval calculator
Intervals for means and proportions.