Post-test probability calculator
Start with how likely the diagnosis was before the test, add the test's likelihood ratio, and get the probability after the result, drawn on a Fagan nomogram.
Your estimate before the test, e.g. the prevalence in similar patients.
Show the working, step by step
Turn the pre-test probability into odds.
odds = p ÷ (1 − p) = 0.25 ÷ 0.75 = 0.333333
Multiply by the likelihood ratio.
post-test odds = 0.333333 × 6 = 2
Turn the odds back into a probability.
p = odds ÷ (1 + odds) = 2 ÷ 3 = 0.666667
On the nomogram, a straight line from the pre-test probability through the likelihood ratio lands on the post-test probability.
The formula
pre-test odds = p ÷ (1 − p) post-test odds = pre-test odds × LR post-test probability = post-test odds ÷ (1 + post-test odds)
With sensitivity and specificity instead of an LR, use LR+ = sensitivity ÷ (1 − specificity) after a positive result and LR− = (1 − sensitivity) ÷ specificity after a negative one.
Worked example
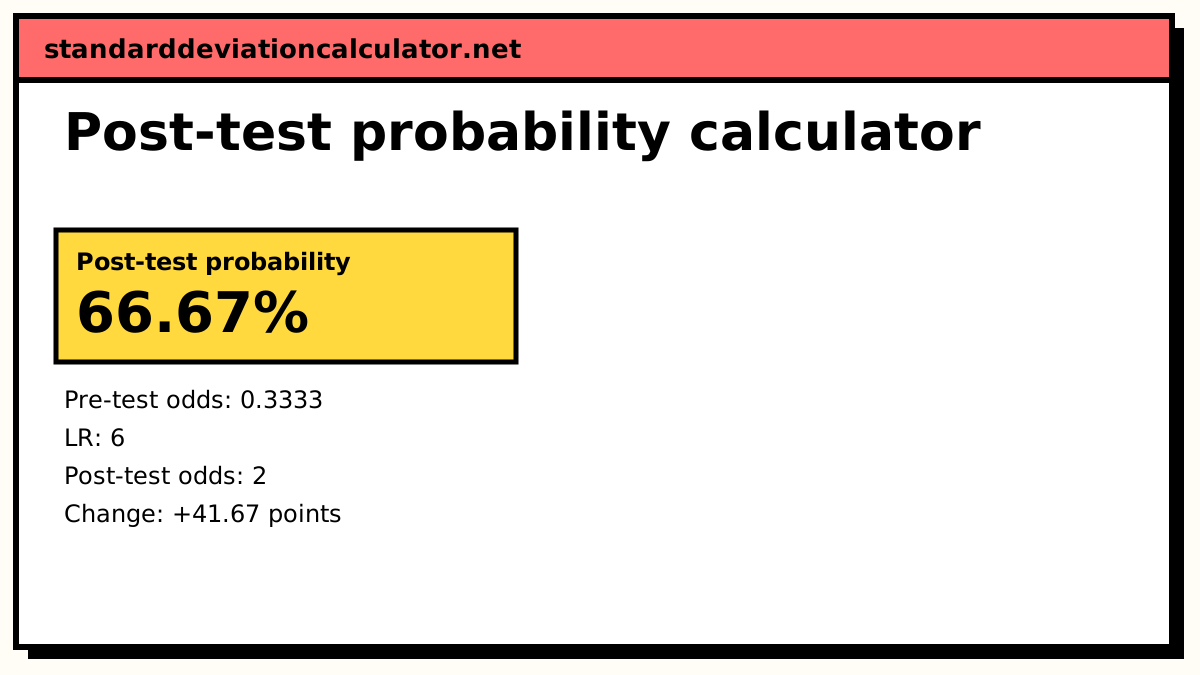
The default: a patient with a 25% pre-test probability has a positive result on a test with LR+ = 6.
- Pre-test odds = 0.25 ÷ 0.75 = 1/3 (one to three).
- Post-test odds = 1/3 × 6 = 2 (two to one).
- Post-test probability = 2 ÷ 3 = 66.67%, a rise of 41.67 percentage points.
Switch to sensitivity and specificity mode with the defaults of 90% and 85%. LR+ = 0.9 ÷ 0.15 = 6, so a positive result gives the same 66.67%. Choose a negative result instead: LR− = 0.1 ÷ 0.85 = 0.1176, the post-test odds are 1/3 × 0.1176 = 0.0392, and the probability falls to 3.77%.
Reading the nomogram
The left scale runs from 0.1% at the top to 99.9% at the bottom; the right scale runs the other way. Both are on the log-odds scale, so each is evenly spaced in logit(p) = ln(p ÷ (1 − p)). The middle scale is ln(LR) ÷ 2. Because ln(post-test odds) = ln(pre-test odds) + ln(LR), the three marked points always fall on one straight line.
How to interpret the result
Likelihood ratios have rough rules of thumb. LR+ above 10 or LR− below 0.1 usually changes a decision; 5 to 10 or 0.1 to 0.2 moderately; 2 to 5 or 0.2 to 0.5 a little; close to 1, hardly at all. But the effect also depends on where you start. The same LR+ of 6 moves a 1% pre-test probability only to about 5.7%, while it moves 25% to 67%. Tests are most useful when the pre-test probability is in the middle range, where the result can push it across a treatment or testing threshold.
Where the likelihood ratio comes from
Published studies of a test usually report sensitivity and specificity, sometimes with LR+ and LR−. If you have the study's 2×2 table, the sensitivity and specificity calculator gives both likelihood ratios with confidence intervals. Using the ends of those intervals here shows how uncertain the post-test probability is.
Common mistakes
- Multiplying the probability, not the odds, by the LR. 25% × 6 = 150% is impossible; the odds method keeps the answer between 0 and 1.
- Using LR+ after a negative result. A negative result needs LR−, which is below 1 and lowers the probability.
- Chaining dependent tests as if independent. The second test's LR applies only if it adds information the first did not.
- Using a pre-test probability of 0% or 100%. No test result can change a certainty, so the calculator asks for a value strictly between.
Common questions
What is post-test probability?
The probability that a patient has a condition after a test result is known. It starts from the pre-test probability (your estimate before testing) and is updated by the test's likelihood ratio, using Bayes' theorem in odds form.
How do I calculate post-test probability?
Convert the pre-test probability to odds, multiply by the likelihood ratio, and convert back: odds = p ÷ (1 − p); post-test odds = pre-test odds × LR; post-test probability = odds ÷ (1 + odds). From 25% and LR 6: odds 1/3 × 6 = 2, so the probability is 2 ÷ 3 = 66.7%.
Where do I get the pre-test probability?
From the prevalence of the condition in patients like this one, adjusted for their symptoms and risk factors, or from a validated clinical prediction rule (such as the Wells score for deep vein thrombosis). It is an estimate, so it is worth checking how much the answer changes if you vary it.
What is a Fagan nomogram?
A chart with three vertical scales: pre-test probability on the left, likelihood ratio in the middle and post-test probability on the right. A straight line from the pre-test probability through the LR lands on the post-test probability. Terrence Fagan published it in 1975. The calculator draws one for your numbers.
Can I apply two tests one after the other?
Yes, if the results are independent given disease status: use the first post-test probability as the pre-test probability for the second test. Tests that measure related things (two imaging tests of the same lesion, say) are usually not independent, and chaining them overstates the certainty.
Related calculators
-
Sensitivity and specificity
Get LR+ and LR− with confidence intervals from a 2×2 table.
-
False positive paradox
Why rare conditions give mostly false positives.
-
Bayes' theorem
Posterior probabilities from priors and likelihoods.