Accuracy calculator
Find the accuracy of a test or model from its four counts, from its sensitivity and specificity, or the percent accuracy of a single measurement against the true value.
Decimal, fraction or percentage.
| Predicted positive | Predicted negative | Total | |
|---|---|---|---|
| Actual positive | TP = 45 | FN = 10 | 55 |
| Actual negative | FP = 5 | TN = 40 | 45 |
| Total | 50 | 50 | 100 |
TP: 45 (45%) TN: 40 (40%) FP: 5 (5%) FN: 10 (10%)
Show the working, step by step
Count the correct results (the diagonal) and the total.
correct = 45 + 40 = 85 n = 45 + 40 + 5 + 10 = 100
Accuracy is correct ÷ total.
85 ÷ 100 = 0.85 = 85%
Balanced accuracy averages the accuracy within each actual class.
sensitivity = 45 ÷ 55 = 0.818182 specificity = 40 ÷ 45 = 0.888889 balanced = (0.818182 + 0.888889) ÷ 2 = 0.853535
The formulas
accuracy = (TP + TN) ÷ (TP + TN + FP + FN) balanced accuracy = (sensitivity + specificity) ÷ 2 accuracy = sensitivity × prevalence + specificity × (1 − prevalence) percent accuracy = 100% − |measured − true| ÷ |true| × 100%
Worked example from counts
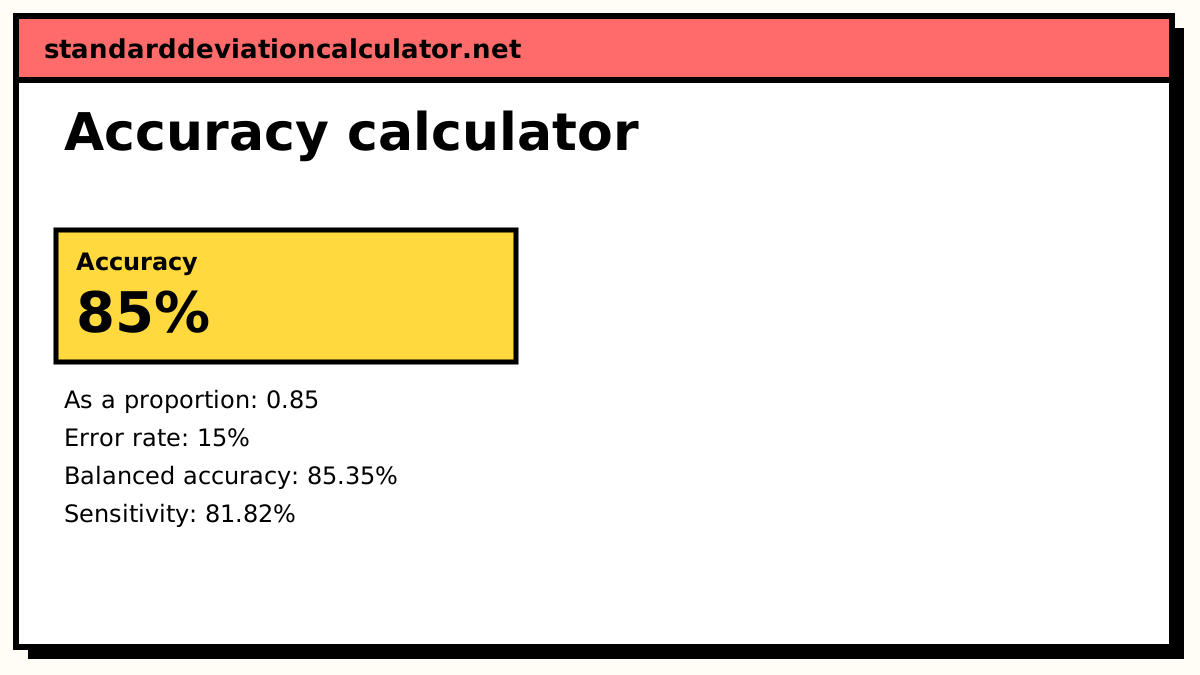
The default is a test run on 100 people: 45 true positives, 40 true negatives, 5 false positives and 10 false negatives.
accuracy = (45 + 40) ÷ 100 = 0.85 = 85%
The test is right 85 times in 100 and wrong 15 times. Splitting by class, sensitivity is 45 ÷ 55 = 81.82% (it finds 45 of the 55 true positives) and specificity is 40 ÷ 45 = 88.89%. Balanced accuracy is the average of the two, 85.35%. Here it is close to plain accuracy because the classes are nearly the same size.
Worked example from sensitivity and specificity
Switch the mode to rates. A test with 90% sensitivity and 80% specificity, used where 10% of people have the condition:
accuracy = 0.9 × 0.1 + 0.8 × 0.9 = 0.09 + 0.72 = 0.81
Accuracy is 81%, while balanced accuracy is (0.9 + 0.8) ÷ 2 = 85%. Accuracy leans towards specificity here because 90% of the people tested do not have the condition.
Worked example for a measurement
In measurement mode, a reading of 9.6 against a true value of 10 gives an absolute error of 0.4, a percent error of 0.4 ÷ 10 × 100 = 4%, and a percent accuracy of 96%. The calculator also says whether the reading was over or under.
How to interpret accuracy
Accuracy is easy to explain, and misleading when the classes are unbalanced. If 1% of transactions are fraudulent, a model that never flags fraud is 99% accurate and useless. In that situation look at balanced accuracy, the F1 score or the Matthews correlation coefficient, all of which the confusion matrix calculator gives. Report sensitivity and specificity alongside accuracy for any diagnostic test.
Accuracy and error rate
The error rate is simply 1 − accuracy: 15% in the default example, made of 5 false positives and 10 false negatives. Two tests with the same error rate can make very different mistakes, one missing cases and the other raising false alarms, so look at where the errors fall as well as how many there are.
Common mistakes
- Comparing accuracies from populations with different prevalence. The same test can score 81% in one clinic and 89% in another.
- Mixing up the cells. FP is an actual negative that was predicted positive; FN is an actual positive predicted negative.
- Calling percent accuracy "precision". Precision is about repeatability (or, in classification, TP ÷ predicted positives).
- Using percent error when the true value is zero or near zero. The ratio blows up; report the absolute error instead.
Common questions
How do you calculate accuracy?
For a classifier or diagnostic test, accuracy = (TP + TN) ÷ (TP + TN + FP + FN): the share of all cases it got right. With 45 true positives, 40 true negatives, 5 false positives and 10 false negatives, accuracy = 85 ÷ 100 = 85%.
What is balanced accuracy?
The average of sensitivity and specificity: (TPR + TNR) ÷ 2. It gives the two classes equal weight whatever their sizes, so a model cannot score well just by predicting the majority class. A model that calls everything negative when 95% of cases are negative has 95% accuracy but only 50% balanced accuracy.
How do I get accuracy from sensitivity and specificity?
Weight them by prevalence: accuracy = sensitivity × prevalence + specificity × (1 − prevalence). Because it depends on prevalence, the same test has different accuracy in different populations.
What is percent accuracy of a measurement?
In lab and physics work, percent error = |measured − true| ÷ |true| × 100, and percent accuracy is 100% minus that. A reading of 9.6 against a true value of 10 has a 4% error and 96% accuracy.
Is accuracy the same as precision?
No. In classification, precision is TP ÷ (TP + FP), the share of positive predictions that are right. In measurement, precision means how close repeated measurements are to each other, while accuracy means how close they are to the true value. A scale can be precise (consistent) and still inaccurate (always 2 g too heavy).
Related calculators
-
Confusion matrix calculator
Precision, recall, F1, MCC and kappa from a 2×2 table.
-
Sensitivity and specificity
Sens, spec, PPV, NPV and likelihood ratios with CIs.
-
Percentage calculator
Percent of, percent change and percent difference.