Risk calculator
Compare the risk of an event between a treated (or exposed) group and a control group. One set of counts gives every standard risk measure, from absolute risk to the number needed to treat.
| Events | No event | Total | Absolute risk | Odds | |
|---|---|---|---|---|---|
| Treated / exposed | 15 | 135 | 150 | 10% | 0.1111 |
| Control / unexposed | 30 | 120 | 150 | 20% | 0.25 |
Show the working, step by step
Absolute risk is events ÷ people in each group.
R₁ = 15 ÷ 150 = 0.1 R₀ = 30 ÷ 150 = 0.2
Relative risk and relative risk reduction.
RR = R₁ ÷ R₀ = 0.5 RRR = 1 − RR = 0.5
Absolute risk reduction and the number needed to treat.
ARR = R₀ − R₁ = 0.1 NNT = 1 ÷ |ARR| = 10
The odds ratio compares odds (events ÷ non-events) instead of risks.
OR = (15 × 120) ÷ (135 × 30) = 0.444444
Intervals use the log method: SE(ln RR) = √(1/a − 1/n₁ + 1/c − 1/n₀) and SE(ln OR) = √(1/a + 1/b + 1/c + 1/d).
RR 95% CI: 0.2808 to 0.8903 OR 95% CI: 0.2282 to 0.8658
The odds ratio is close to the relative risk only when the event is rare (under about 10%) in both groups. Here the risks are 10% and 20%.
The formulas
R₁ = a ÷ n₁ R₀ = c ÷ n₀ RR = R₁ ÷ R₀ RRR = 1 − RR ARR = R₀ − R₁ NNT = 1 ÷ |ARR| OR = [a ÷ (n₁ − a)] ÷ [c ÷ (n₀ − c)]
When the treated or exposed group has the higher risk, ARR is negative. The calculator then reports the attributable risk R₁ − R₀, the relative risk increase RR − 1, the attributable fraction (RR − 1) ÷ RR and the number needed to harm.
Worked example
The default is a trial with 150 people in each arm. The event happens to 15 treated patients and 30 controls.
- Absolute risks: 15 ÷ 150 = 10% treated, 30 ÷ 150 = 20% control.
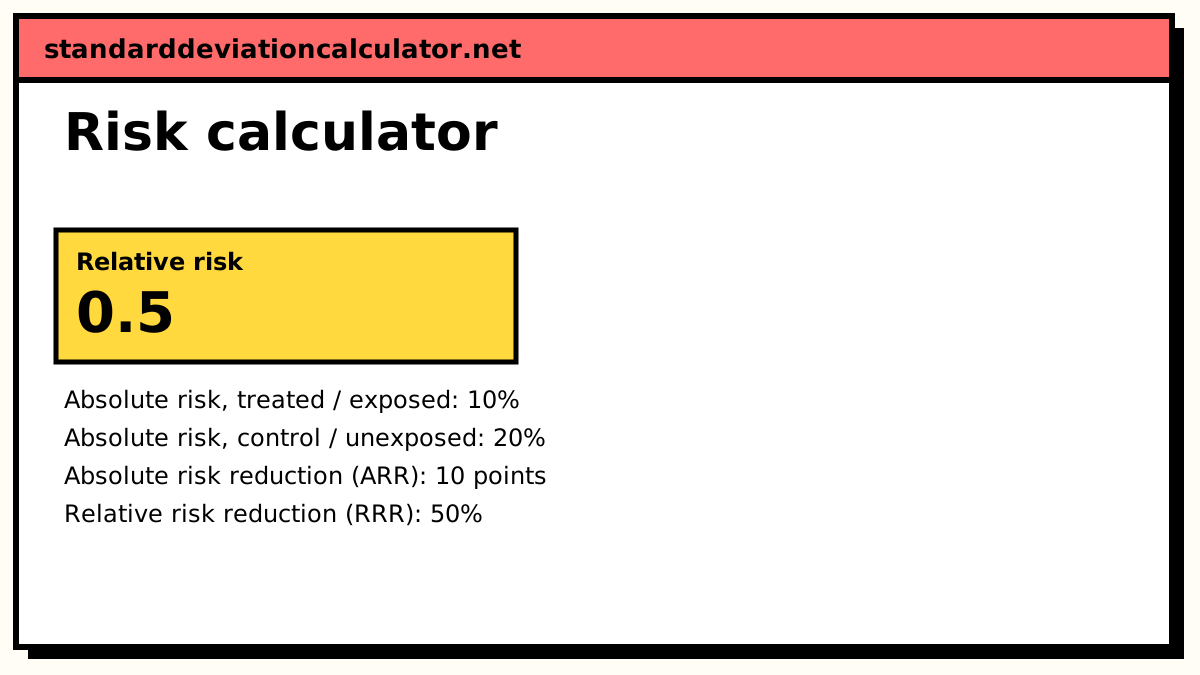
- Relative risk: 0.1 ÷ 0.2 = 0.5, 95% CI 0.28 to 0.89. Treatment halves the risk.
- Relative risk reduction: 1 − 0.5 = 50%.
- Absolute risk reduction: 0.2 − 0.1 = 0.1, or 10 percentage points.
- Number needed to treat: 1 ÷ 0.1 = 10.
- Odds ratio: (15 × 120) ÷ (135 × 30) = 0.444, 95% CI 0.23 to 0.87.
The RR interval does not include 1, so the reduction is statistically significant at the 5% level. The odds ratio, 0.44, is further from 1 than the relative risk, as it always is, and noticeably so here because a 20% control risk is not rare.
How to interpret the numbers
The relative measures (RR, RRR, OR) tell you how strong the effect is; the absolute measures (ARR, NNT) tell you how much it matters to a group of patients. An RRR of 50% sounds the same whether the control risk is 20% or 0.2%, but the NNT would be 10 in the first case and 1,000 in the second. Decide whether a treatment is worth its cost and side effects with the absolute numbers.
NNT has a time frame: it is the number treated for the length of the study. An NNT of 10 over one year is not the same as 10 over five years.
A harmful exposure
Swap the numbers so that 30 of 150 exposed people and 15 of 150 unexposed people have the event. RR becomes 2, the attributable risk is 10 percentage points, the attributable fraction among the exposed is (2 − 1) ÷ 2 = 50%, and the number needed to harm is 10: for every ten people exposed, one extra event.
Common mistakes
- Quoting only the relative risk reduction. Without the baseline risk, readers cannot judge the benefit.
- Using the odds ratio as if it were a relative risk when the outcome is common. An OR of 0.44 does not mean the risk fell by 56%.
- Rounding NNT down. An NNT of 9.1 becomes 10, not 9, so the benefit is not overstated.
- Treating an association in observational data as the effect of the exposure. The attributable fraction assumes a causal link.
Common questions
What is the difference between absolute and relative risk reduction?
Absolute risk reduction (ARR) is the difference in risk: control risk minus treated risk. Relative risk reduction (RRR) is that difference as a share of the control risk: ARR ÷ R₀ = 1 − RR. A drug that cuts risk from 2% to 1% has an ARR of 1 percentage point and an RRR of 50%. Both are true, but the RRR sounds far more impressive.
How do I calculate the number needed to treat?
NNT = 1 ÷ ARR. With an ARR of 0.1 (10 percentage points), NNT = 10: treat ten people to prevent one event. NNT is rounded up to a whole person. If the treated group has the higher risk, the same formula gives the number needed to harm (NNH).
What is attributable risk?
The extra risk among the exposed that is due to the exposure, R₁ − R₀, assuming the association is causal. The attributable fraction among the exposed, (RR − 1) ÷ RR, is the share of their cases that would not have happened without the exposure. The calculator shows these when the exposed group has the higher risk.
When is the odds ratio close to the relative risk?
When the outcome is rare in both groups, below about 10%. Then events ÷ non-events is close to events ÷ total, so odds and risks nearly match. With common outcomes the odds ratio exaggerates the effect: here risks of 10% and 20% give RR = 0.5 but OR = 0.44.
Which measure should I report?
Report the absolute risks in each group, then a relative measure (RR, or OR for a case-control study) with its confidence interval, and the ARR or NNT to show the practical size of the effect. Guidelines such as CONSORT ask for both absolute and relative effect sizes for binary outcomes.
Related calculators
-
Relative risk calculator
RR with a log-method confidence interval and p-value.
-
Chi-square calculator
Test whether a 2×2 table shows an association.
-
Biostatistics calculator
Common calculations for health data.