False positive paradox calculator
Enter how common the condition is and how good the test is. The calculator shows how many of the positive results are real, as a probability and as a tree of counts.
Decimal, fraction or percentage: 0.001, 1/1000 or 0.1%.
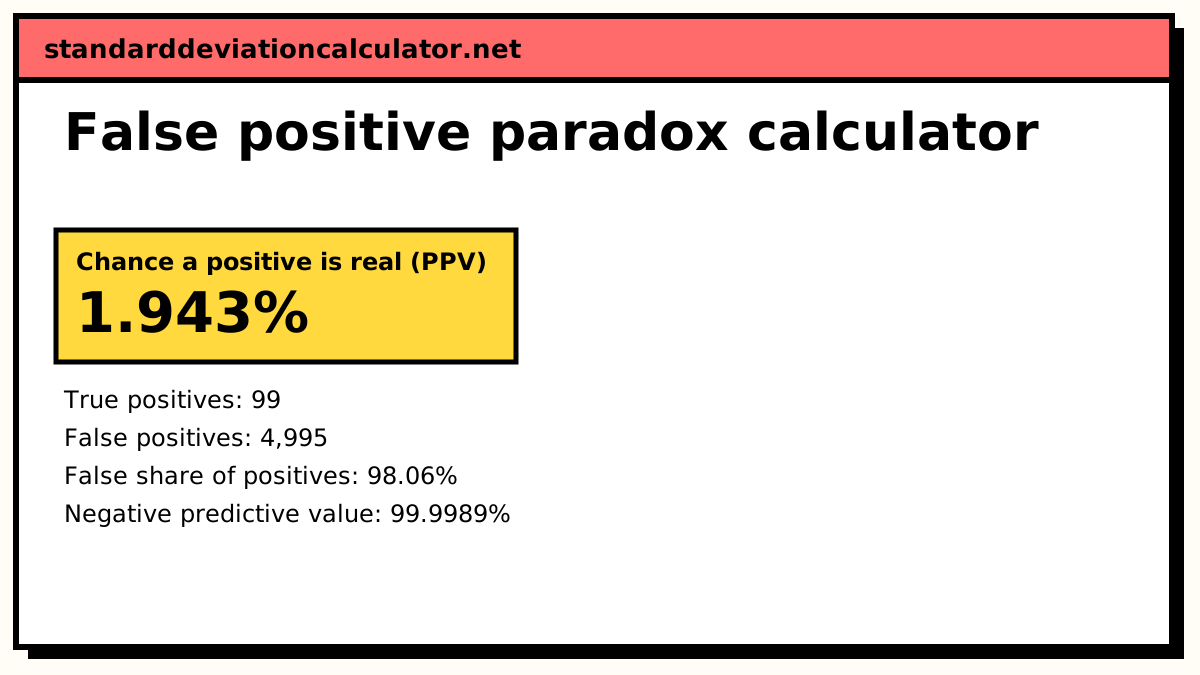
The two highlighted boxes are everyone who tests positive: 99 true + 4,995 false = 5,094.
Show the working, step by step
Split the population by the base rate.
with the condition = 100,000 × 0.001 = 100 without = 100,000 − 100 = 99,900
Sensitivity finds the true positives among the sick.
TP = 100 × 0.99 = 99
One minus specificity gives the false positives among the healthy.
FP = 99,900 × 0.05 = 4,995
PPV is the share of positives that are true.
PPV = 99 ÷ (99 + 4,995) = 0.0194346
A second, independent positive test multiplies the odds by LR+ again.
LR+ = 0.99 ÷ 0.05 = 19.8 PPV after two positives = 28.18%
The paradox is not about a bad test. When the condition is rare, the healthy group is so much bigger that its small false-positive rate produces more positives than the whole sick group can.
The formula
PPV = (sens × prev) ÷ [sens × prev + (1 − spec) × (1 − prev)]
The numerator is the true positives; the second term in the denominator is the false positives. When the prevalence is small, (1 − prev) is close to 1, and the false positives can swamp the true ones even when (1 − spec) is small.
Worked example
The defaults describe a screening test with 99% sensitivity and 95% specificity, used on a condition that 1 in 1,000 people have. Picture 100,000 people:
- 100 have the condition. The test catches 99 of them (true positives) and misses 1.
- 99,900 do not. The test wrongly flags 5% of them: 4,995 false positives. The other 94,905 test negative.
- In total 99 + 4,995 = 5,094 people test positive, and only 99 of them have the condition.
PPV = 99 ÷ 5,094 = 1.94%
So a positive result means roughly a 2% chance of having the condition. Fifty false positives for every true one. The negative result, by contrast, is very reliable: 94,905 of the 94,906 negatives are correct, an NPV of 99.999%.
A second independent positive helps a lot. The positive likelihood ratio is 0.99 ÷ 0.05 = 19.8. The odds after one positive are 99 : 4,995; multiplying by 19.8 gives odds of about 0.39, a probability of 28.2%.
How to interpret the result
Sensitivity and specificity describe the test. PPV and NPV describe what a result means for a person, and they depend on who is being tested. The same test used in a clinic where half the patients have the condition would have a PPV of about 95%. That is why screening programs target high-risk groups, and why a positive screening result is usually followed by a confirmatory test rather than a diagnosis.
If the headline PPV is below 50%, false positives outnumber true positives and the calculator flags it. That is the paradox in one line.
Try changing one input at a time
Raise the base rate from 0.1% to 1% and the PPV jumps from 1.9% to about 16.7%. Raise specificity from 95% to 99.9% instead, keeping the base rate at 0.1%, and the PPV climbs to about 49.8%. Raising sensitivity barely moves it, because sensitivity only acts on the small sick group. When a condition is rare, specificity and the base rate drive the result.
Common mistakes
- Reading "95% accurate" as "a positive is 95% likely to be right". That confuses P(positive | healthy) with P(healthy | positive).
- Leaving out the base rate. Without the prevalence, the chance that a positive is real cannot be worked out at all.
- Using the prevalence of a study sample. Studies often recruit equal numbers of cases and controls, which makes the prevalence 50% and the PPV far higher than in the general population.
Common questions
What is the false positive paradox?
A test can be highly accurate and still give mostly wrong positive results. It happens when the condition is rare: the healthy group is so large that even a small false-positive rate produces more false alarms than there are true cases to find. It is a form of the base rate fallacy.
How do I calculate the positive predictive value?
PPV = (sensitivity × prevalence) ÷ [sensitivity × prevalence + (1 − specificity) × (1 − prevalence)]. With prevalence 0.1%, sensitivity 99% and specificity 95%, that is 0.00099 ÷ (0.00099 + 0.04995) = 1.94%.
Does a second positive test help?
Yes, if the two tests are independent. The first positive raises the probability to the PPV; the second multiplies those odds by the likelihood ratio again. In the default example the PPV goes from 1.94% to 28.2%. Repeating the same test on the same sample is often not independent, so the real gain can be smaller.
Why does the calculator ask for a population size?
Only to turn probabilities into counts. "99 true positives and 4,995 false positives out of 100,000 people" is easier to reason about than a conditional probability, and research by Gerd Gigerenzer and others shows people get these questions right far more often with natural frequencies. The PPV does not depend on N.
Where does this matter in practice?
Population screening for rare diseases, drug testing in workplaces with low drug use, fraud and spam filters, and security screening all face it. Programs deal with it by testing higher-risk groups (raising the base rate) or by confirming every positive with a second, more specific test.
Related calculators
-
Bayes' theorem
Posterior probability for a medical test.
-
Post-test probability
Pre-test probability and a likelihood ratio, Fagan style.
-
Sensitivity and specificity
Sens, spec, PPV, NPV and likelihood ratios with CIs.