How to calculate standard deviation in Excel
In one line: put your numbers in a column and type =STDEV.S(A1:A20). The rest of
this page covers which function to use when, the errors that trip people up, and the cases
Excel has no built-in function for.
Standard deviation in Excel: the short version
- Put your values in a column, say A1 to A20, one number per cell, nothing else in the range.
- Click an empty cell.
- Type
=STDEV.S(A1:A20)and press Enter.
That gives the sample standard deviation, which is what you want unless
those twenty rows are the complete group you are describing. If they are, use
=STDEV.P(A1:A20) instead. Paste the same column into the
standard deviation calculator to check your formula is picking up the right cells.
Which standard deviation to use in Excel: STDEV.S or STDEV.P
| Function | Divides by | Use for | Notes |
|---|---|---|---|
| STDEV.S | n − 1 | Sample | The usual choice |
| STDEV.P | n | Population | Only when nothing is left out |
| STDEV | n − 1 | Sample | Legacy name for STDEV.S |
| STDEVP | n | Population | Legacy name for STDEV.P |
| STDEVA | n − 1 | Sample | Counts text as 0, TRUE as 1 |
| STDEVPA | n | Population | Same, population form |
| VAR.S / VAR.P | n − 1 / n | Variance | The value before the square root |
Avoid STDEVA and STDEVPA unless you specifically want text counted
as zero. That behaviour turns a stray label into a data point of 0, which drags the mean down
and inflates the spread: a silent and hard-to-spot error.
Standard deviation with a condition
There is no STDEVIF. To get the standard deviation of only the rows matching a
criterion, wrap an IF inside STDEV.S:
=STDEV.S(IF(B2:B100="North", A2:A100))
In Microsoft 365 and Excel 2021 that works as typed, because those versions spill array results automatically. In Excel 2019 and earlier you must confirm it with Ctrl+Shift+Enter, which wraps it in braces.
For more than one condition, multiply the tests together:
=STDEV.S(IF((B2:B100="North")*(C2:C100>50), A2:A100))
Things Excel has no function for
| You want | Build it as |
|---|---|
| Relative SD (%RSD) | =STDEV.S(A1:A20)/AVERAGE(A1:A20)*100 |
| Coefficient of variation | =STDEV.S(A1:A20)/AVERAGE(A1:A20) |
| Standard error of the mean | =STDEV.S(A1:A20)/SQRT(COUNT(A1:A20)) |
| Weighted mean | =SUMPRODUCT(A2:A20,B2:B20)/SUM(B2:B20) |
| Ignoring error cells | =AGGREGATE(7,6,A1:A20) |
| 95% margin of error | =CONFIDENCE.T(0.05,STDEV.S(A1:A20),COUNT(A1:A20)) |
Errors and what causes them
| Symptom | Cause | Fix |
|---|---|---|
| #DIV/0! | Fewer than 2 numeric cells for STDEV.S | Check the numbers are not stored as text |
| #VALUE! | A direct argument is non-numeric | Reference a range rather than typing values |
| #NAME? | Function misspelled, or STDEV.S in a pre-2010 file | Use STDEV for old versions |
| Returns 0 | Every value is identical | Correct: zero spread |
| Number looks too small | Blank or text cells being skipped | Compare COUNT against COUNTA |
The text-stored-as-number trap is the big one. Data pasted from a website or
imported from CSV often arrives as text. Excel silently omits those cells from
STDEV.S, so you get an answer, just one computed from a fraction of your rows.
Check by comparing =COUNT(A1:A20) (numbers only) with
=COUNTA(A1:A20) (anything non-empty). If they disagree, some rows are text.
Google Sheets
Every function above works identically in Google Sheets, including the dotted names.
STDEV, STDEVP, STDEV.S and STDEV.P all
behave the same way. The one difference worth knowing is that Sheets requires
ARRAYFORMULA() around the conditional pattern rather than
Ctrl+Shift+Enter:
=ARRAYFORMULA(STDEV(IF(B2:B100="North", A2:A100)))
Check your spreadsheet against this calculator
Copy the column out of your sheet and paste it below. The result should match your
STDEV.S exactly, and if it does not, the count reported here will usually show
why, because it tells you how many values were actually read.
Separate numbers with commas, spaces or new lines, or paste a spreadsheet column.
Decimals and negatives are fine; write 10:3 for a value that occurs 3 times.
Your results will appear here: the standard deviation first, then the rest of the summary and a chart.
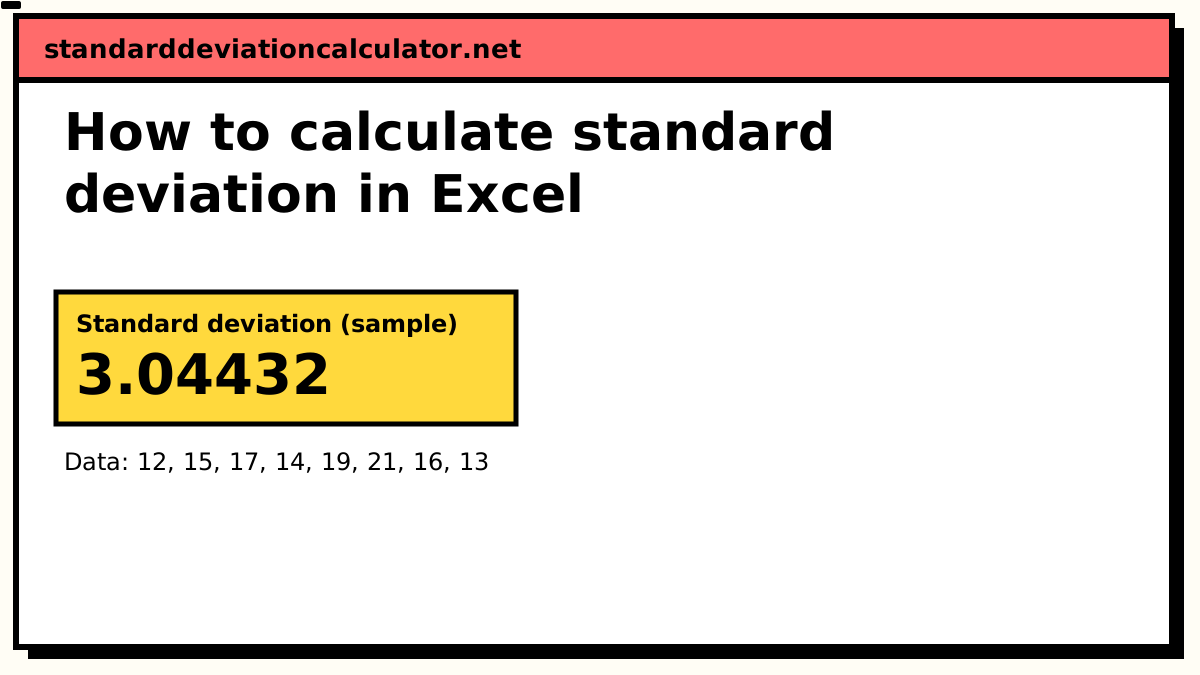
Standard deviation (sample)
3.04432
3.04
Your values typically sit about 3.04 above or below their mean of 15.88, in the same units as your data. 5 of 8 values (63%) fall between 12.83 and 18.92, within one standard deviation of the mean; for normally distributed data about 68% would.
Population SD (σ): 2.8477, if these values are the whole group.
- Count (n)
- 8
- Mean (x̄)
- 15.875
- Variance (s²)
- 9.26786
- Standard error
- 1.07633
- Minimum
- 12
- Q1 (25%)
- 13.75
- Median
- 15.5
- Q3 (75%)
- 17.5
- Maximum
- 21
- Range
- 9
More statistics (5)
- Relative SD (%RSD)
- 19.1768%
- Coefficient of variation
- 0.191768
- Sum (Σx)
- 127
- Sum of squares, Σ(x − x̄)²
- 64.875
- IQR (Q3 − Q1)
- 3.75
Data distribution
Shaded bands mark ±1, ±2 and ±3 SD from the mean. 5 of 8 values (63%) fall within ±1 SD.
Chart as text
Mean 15.875, sample standard deviation s = 3.04432, from 8 values between 12 and 21.
- Within ±1 SD (12.83 to 18.92): 5 of 8 values (63%). About 68% for normal data.
- Within ±2 SD: 8 (100%). About 95% for normal data.
- Within ±3 SD: 8 (100%). About 99.7% for normal data.
Show the working, step by step
Related calculators
-
Standard deviation calculator
Paste a column straight from a sheet.
-
Variance calculator
The VAR.S and VAR.P equivalents.
-
Relative SD (%RSD)
Excel has no built-in; build it from two functions.
-
SD on a TI-84
The same calculation on a graphing calculator.
Common questions
What is the formula for standard deviation in Excel?
=STDEV.S(A1:A20) for a sample, =STDEV.P(A1:A20) for a
population. Replace the range with your own cells.
What is the difference between STDEV.S and STDEV.P?
STDEV.S divides by n − 1 and is for sample data. STDEV.P
divides by n and is for a complete population. Use STDEV.S unless your rows
genuinely are the entire group.
The full comparison is here.
Is STDEV the same as STDEV.S?
Yes. STDEV() is the pre-2010 name and still works for backward
compatibility; it is the sample version. STDEVP() is likewise the old name for
STDEV.P. New workbooks should use the dotted forms, which are clearer about
what they do.
Why does my Excel standard deviation return #DIV/0!
Almost always because STDEV.S received fewer than two numeric cells. It
needs at least two, since it divides by n − 1.
The usual cause is that the numbers are stored as text: they will be left-aligned in the cell, and Excel skips them. Select the range, click the warning triangle, and choose "Convert to Number".
How do I calculate standard deviation ignoring blanks and errors?
STDEV.S already ignores blank cells and text. To ignore error values too,
use =AGGREGATE(7, 6, A1:A20): 7 selects STDEV.S and 6 tells it to skip
errors.
Frequently asked questions about standard deviation in Excel
Common questions
Why does Python give a different standard deviation result?
Standard deviation is a measure of how spread out a set of numbers is around their mean. It is the square root of the average squared distance from the mean, expressed in the same units as the original data. A small standard deviation means values cluster close to the mean; a large one means they are widely scattered. See what is standard deviation for a full explanation with examples.
How can I check a Python standard deviation result with an online calculator?
Standard deviation is a measure of how spread out a set of numbers is around their mean. It is the square root of the average squared distance from the mean, expressed in the same units as the original data. A small standard deviation means values cluster close to the mean; a large one means they are widely scattered. See what is standard deviation for a full explanation with examples.