Spread, shape and outlier calculators
Calculators that measure how spread out a dataset is, how lopsided its distribution is, and which values look like outliers. They also cover relative spread for comparing datasets on different scales, and the capability indices used in quality control.
Which calculator do I need?
| You have or want | Use |
|---|---|
| Every measure of spread at once, to compare them | Dispersion calculator |
| The simplest spread: largest minus smallest | Range calculator |
| The average distance from the mean, without squaring | Mean absolute deviation |
| A spread measure that outliers cannot distort | Median absolute deviation |
| Compare spread across datasets with different units or means | Coefficient of variation |
| Whether the distribution leans left or right | Skewness calculator |
| Which values are outliers | Outlier calculator |
| Whether a process fits inside its specification limits | Process capability index |
Full summaries
One paste gives the whole picture: centre, spread and shape in a single table.
-
Descriptive statistics calculator
Count, mean, SD, quartiles, skewness and kurtosis in one summary table.
-
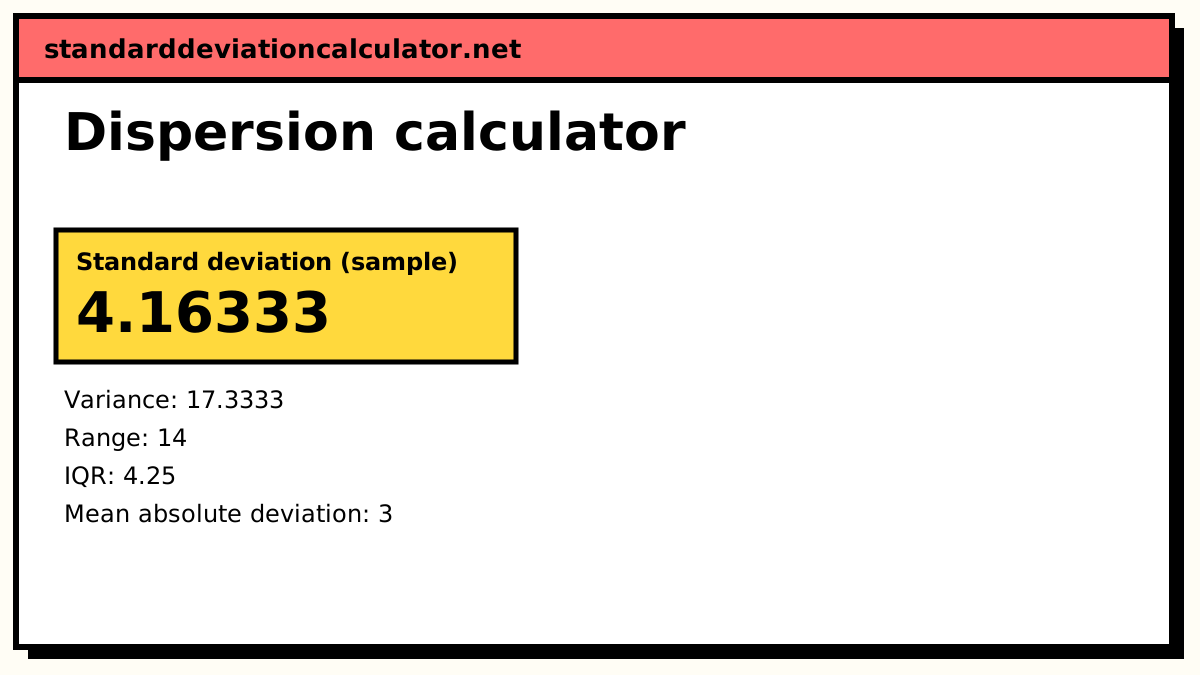
Dispersion calculator
Range, IQR, quartile deviation, mean and median absolute deviation, variance, SD, CV and the index of dispersion in one table.
Range and deviation measures
Absolute measures of spread, in the same units as the data, from the simplest to the most outlier-resistant.
-
Range calculator
Maximum minus minimum, with the IQR, SD, midrange and an outlier check.
-
Min and max calculator
The smallest and largest values, with ties counted, the range and the midrange.
-
Coefficient of range calculator
Range and the coefficient of range (L − S)/(L + S) for raw or grouped data.
-
Mean absolute deviation
The average absolute distance from the mean, Σ|x − x̄| ÷ n, step by step.
-
Mean deviation calculator
Mean deviation about the mean, median or mode, with its coefficient, for all three series types.
-
Median absolute deviation calculator
MAD, the 1.4826-scaled estimate of σ and modified z-scores for every value.
-
Sum of squares calculator
The sum of squared deviations Σ(x − x̄)², the building block of variance.
Relative spread and categorical variation
Spread as a ratio or percentage of the mean, and variation for data that are categories rather than numbers.
-
Coefficient of variation
SD ÷ mean, to compare the spread of datasets measured on different scales.
-
Relative standard deviation (%RSD)
The SD as a percentage of the mean (%RSD), the usual precision figure in labs.
-
Index of qualitative variation calculator
IQV for categorical data: (K/(K − 1))(1 − Σp²), from category counts.
Shape and outliers
How lopsided the distribution is and which values sit unusually far from the rest.
-
Skewness calculator
Fisher–Pearson g₁, adjusted G₁, both Pearson coefficients, the standard error of skewness and a z test.
-
Outlier calculator
Flag outliers by Tukey fences, z-scores, modified z-scores and Grubbs’ test, side by side.
-
Outlier & IQR calculator
The interquartile range with Tukey fences and Grubbs’ test to flag outliers.
-
Upper and lower fence calculator
Lower and upper fences Q₁ − k·IQR and Q₃ + k·IQR, from data or from the quartiles.
Quality control
Spread measured against a specification or a peer group, as used in manufacturing and clinical labs.
-
Process capability index calculator
Cp, Cpk, Pp and Ppk from measurements or summary figures, with ppm and sigma level.
-
Cpk & process capability
Cp and Cpk from the mean, SD and specification limits, with the sigma level.
-
Standard deviation index calculator
SDI = (lab mean − peer mean) ÷ peer SD for lab QC, with the CV ratio.
Measures of spread compared
Two datasets can share a mean and still look nothing alike. Both of these have a mean of 50:
| Measure | A: 48, 49, 50, 51, 52 | B: 30, 40, 50, 60, 70 |
|---|---|---|
| Range | 4 | 40 |
| Mean absolute deviation | 1.2 | 12 |
| Sample standard deviation | 1.581 | 15.81 |
| Coefficient of variation | 3.2% | 31.6% |
Every measure agrees that B is ten times as spread out; they differ in how they get there and how they react to awkward data.
- The range uses only the two extremes, so a single outlier changes it completely.
- The mean absolute deviation averages distances without squaring them, so it is easy to explain and less swayed by one large value than the SD.
- The standard deviation squares the distances, which gives large deviations more weight. It is the measure that connects to the normal distribution, confidence intervals and tests.
- The median absolute deviation is built from medians, so up to half the data can be wild before it breaks. Multiplied by 1.4826 it estimates σ for normal data.
- The coefficient of variation divides by the mean, which lets you compare the spread of weights in kilograms with heights in centimetres. Use it only for data on a ratio scale with a true zero.
Shape and outliers
Skewness near zero means a roughly symmetric distribution; positive skew means a long right tail (a few large values), negative skew a long left tail. The outlier calculator runs Tukey fences, z-scores, modified z-scores and Grubbs’ test together, because they do not always agree: fences built on quartiles hold up well with skewed data, while z-score rules assume rough normality and can be masked by the very outliers they are looking for.
An outlier is a prompt to check the value, not a licence to delete it. Look for typing or measurement errors first, and report any values you exclude.