Statistics
Mean deviation calculator
Mean deviation is the average distance of the observations from their centre. Choose the centre (mean, median or mode) and the type of series, and the calculator builds the deviation table and works out the mean deviation and its coefficient.
Separate with commas, spaces or new lines.
Exclusive classes (10-20, 20-30) or inclusive classes (10-19, 20-29). Inclusive classes are converted to class boundaries.
The red line is the mean. The shaded band runs from 7 to 13: one mean deviation either side. The mean deviation is the average distance of the values from the red line.
| x | |x − x̄| |
|---|---|
| 4 | 6 |
| 7 | 3 |
| 8 | 2 |
| 9 | 1 |
| 10 | 0 |
| 12 | 2 |
| 13 | 3 |
| 17 | 7 |
| Σ | 24 |
Show the working, step by step
Mean: add the values and divide by n.
x̄ = Σx/n = 80/8 = 10
Take each value's distance from x̄ = 10, ignoring the sign, and add them.
Σ|x − x̄| = 6 + 3 + 2 + 1 + 0 + 2 + 3 + 7 = 24
Divide by n.
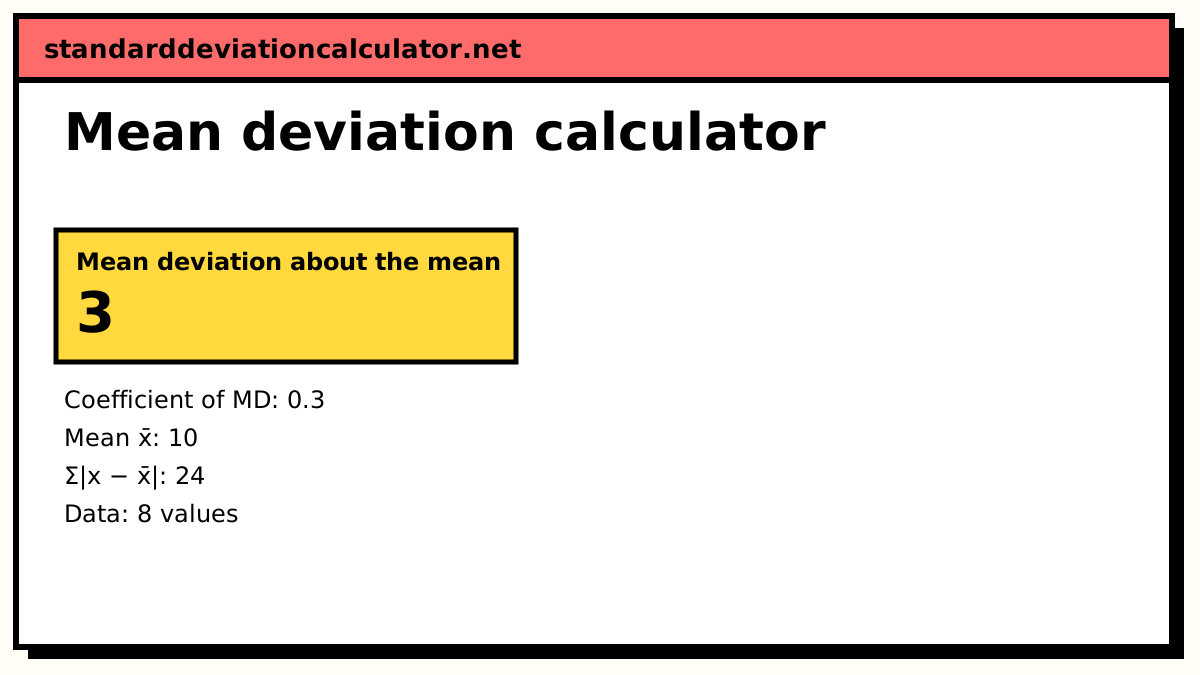
MD(x̄) = Σ|x − x̄|/n = 24/8 = 3
Coefficient of mean deviation: MD divided by the average it was measured from.
MD(x̄)/x̄ = 3/10 = 0.3
The mean deviation about the median is never larger than about any other point, which is why some books prefer the median as the centre.
Formulas
With A standing for the mean x̄, the median M or the mode Z:
Individual series: MD(A) = Σ|x − A| / n Discrete series: MD(A) = Σf|x − A| / N Continuous series: MD(A) = Σf|m − A| / N (m = class midpoint) Coefficient of MD = MD(A) / A
The vertical bars mean “ignore the sign”. For grouped data every observation in a class is
treated as if it sat at the midpoint m, and the median and mode come from the usual grouped
formulas: M = L + ((N/2 − cf)/f) × h and
Z = L + ((f₁ − f₀)/(2f₁ − f₀ − f₂)) × h.
Worked example: individual series
The calculator's default list is 4, 7, 8, 9, 10, 12, 13, 17 (n = 8).
- Mean: x̄ = 80/8 = 10.
- Absolute deviations |x − 10|: 6, 3, 2, 1, 0, 2, 3, 7. Their sum is 24.
- MD about the mean = 24/8 = 3.
- Coefficient of MD = 3/10 = 0.3.
About the median (the average of the 4th and 5th values, 9.5) the deviations are 5.5, 2.5, 1.5, 0.5, 0.5, 2.5, 3.5 and 7.5, which also add to 24, so the MD is again 3. Here the two centres happen to give the same answer; with skewed data the median version is usually smaller.
Worked example: continuous series
A standard NCERT-style table with N = 40:
| Class | f | m | |m − 45| | f|m − 45| |
|---|---|---|---|---|
| 10-20 | 2 | 15 | 30 | 60 |
| 20-30 | 3 | 25 | 20 | 60 |
| 30-40 | 8 | 35 | 10 | 80 |
| 40-50 | 14 | 45 | 0 | 0 |
| 50-60 | 8 | 55 | 10 | 80 |
| 60-70 | 3 | 65 | 20 | 60 |
| 70-80 | 2 | 75 | 30 | 60 |
| Σ | 40 | 400 |
The mean is Σfm/N = 1,800/40 = 45, so MD about the mean = 400/40 = 10 and the coefficient is 10/45 = 0.2222. The distribution is symmetric, so the median and the mode are also 45 and give the same MD. Enter these classes in the continuous table to check.
When to use mean deviation
Mean deviation is easy to explain (“on average, a value is 3 marks from the mean”) and is less affected by one extreme value than the standard deviation, because it does not square the distances. Its weakness is that absolute values are awkward in further algebra, which is why the standard deviation dominates in sampling and inference.
Common mistakes
- Keeping the signs. Deviations from the mean sum to zero; you must take absolute values.
- Forgetting the frequencies. In a discrete or grouped series multiply each |x − A| by f before adding, and divide by N = Σf, not by the number of rows.
- Using class limits instead of midpoints. For grouped data the deviation is from each class midpoint.
- Mixing up the coefficient. Divide the MD by the same average it was measured from.
Common questions
What is mean deviation?
The average distance of the observations from a central value, ignoring whether each one is above or below it. For 4, 7, 8, 9, 10, 12, 13 and 17 the mean is 10, the distances add up to 24, and the mean deviation is 24/8 = 3.
Should I take mean deviation about the mean or the median?
Use whichever your question asks for. Many textbooks prefer the median, because the sum of absolute deviations is smallest when measured from the median, so the mean deviation about the median is never larger than about any other point for ungrouped data. The mean is used more often in practice because it is the more familiar average. The mode is rarely used, since it is often ill-defined.
What is the coefficient of mean deviation?
The mean deviation divided by the average it was measured from: MD/x̄, MD/M or MD/Z. It has no units, so it compares the relative spread of series measured in different units or with different averages. In the default example it is 3/10 = 0.3.
Why are the signs of the deviations ignored?
Deviations from the mean always add up to zero, so without dropping the signs the average deviation would always be 0. Taking absolute values is one fix; squaring them is the other, and that leads to the variance and standard deviation.
Is mean deviation the same as mean absolute deviation?
Yes, they are two names for the same measure. The site's mean absolute deviation calculator works on a plain list of numbers; this page adds discrete and grouped frequency tables and the choice of mean, median or mode as the centre.
How is mean deviation different from standard deviation?
Mean deviation averages absolute distances; standard deviation squares them, averages, and takes the square root. Squaring weights large deviations more heavily, so the standard deviation is always at least as large as the mean deviation about the mean. For a normal distribution MD is about 0.8 times the SD.
Related calculators
-
Mean absolute deviation
The same measure for a plain list of values.
-
Quartile deviation
Half the interquartile range, and its coefficient.
-
Grouped standard deviation
The standard deviation from class intervals.
-
Coefficient of range
Range and its unit-free coefficient.