Statistics
Decile deviation calculator
A decile-based measure of spread: the distance covered by the middle 80% of the data. Enter a list, an (x, f) table or class intervals, and the calculator finds D₁ and D₉, then the interdecile range, the decile deviation and its coefficient.
Separate with commas, spaces or new lines.
Exclusive classes (10-20, 20-30) or inclusive classes (10-19, 20-29). Inclusive classes are converted to class boundaries.
Grouped (continuous) data always uses the class-interval formula.
| Class | f | cf | Contains |
|---|---|---|---|
| 0-10 | 5 | 5 | D₁ |
| 10-20 | 8 | 13 | |
| 20-30 | 12 | 25 | |
| 30-40 | 15 | 40 | |
| 40-50 | 6 | 46 | D₉ |
| 50-60 | 4 | 50 | |
| N | 50 |
Less-than ogive. The marked points are read off at cumulative frequencies 5, 45.
Show the working, step by step
Add a cumulative frequency (cf) column. N = Σf = 50.
0–10: f = 5, cf = 5 10–20: f = 8, cf = 13 20–30: f = 12, cf = 25 30–40: f = 15, cf = 40 40–50: f = 6, cf = 46 50–60: f = 4, cf = 50
D₁ class: N/10 = 50/10 = 5. The first cumulative frequency ≥ 5 is 5, so the D₁ class is 0–10.
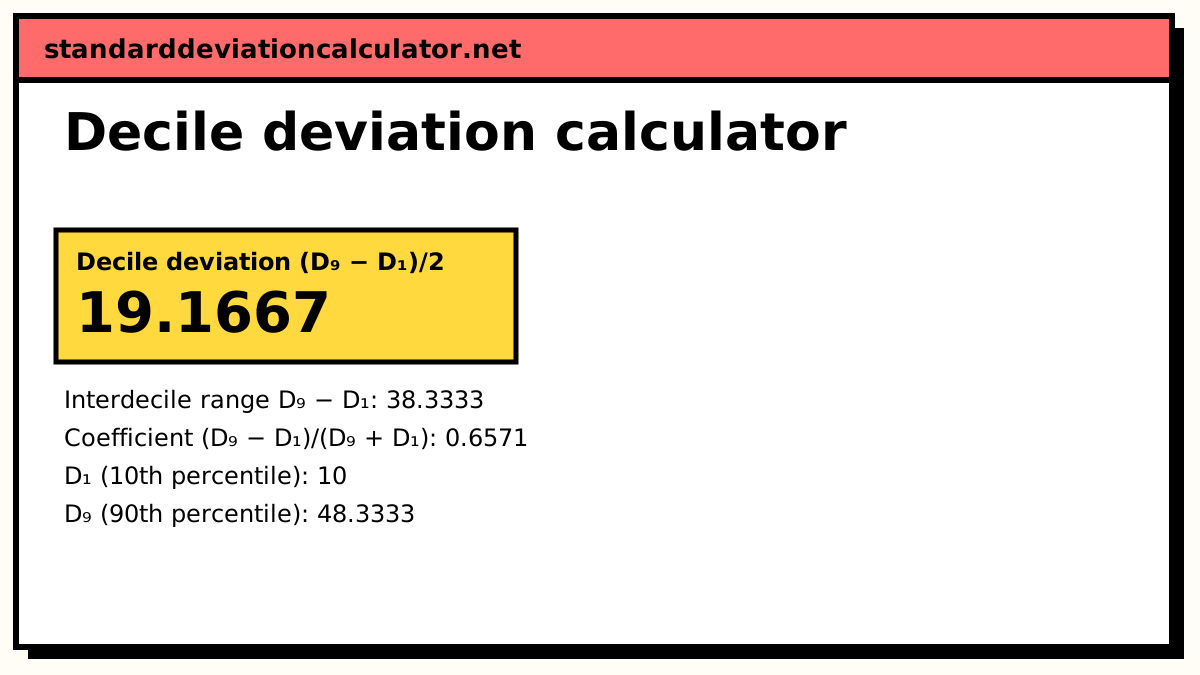
D₁ = L + ((N/10 − cf) / f) × h = 0 + ((5 − 0) / 5) × 10 = 10
D₉ class: 9N/10 = 9 × 50/10 = 45. The first cumulative frequency ≥ 45 is 46, so the D₉ class is 40–50.
D₉ = L + ((9N/10 − cf) / f) × h = 40 + ((45 − 40) / 6) × 10 = 48.3333
Interdecile range: the spread of the middle 80% of the data.
D₉ − D₁ = 48.3333 − 10 = 38.3333
Decile deviation (semi-interdecile range): half of it.
(D₉ − D₁)/2 = 38.3333/2 = 19.1667
Coefficient of decile deviation.
(D₉ − D₁)/(D₉ + D₁) = 38.3333/58.3333 = 0.6571
D₉ − D₁ is the same as the 10–90 percentile range P₉₀ − P₁₀.
Definitions used on this page
Textbooks vary in what they call “decile deviation”, so here are the three measures the calculator reports:
Interdecile range (10–90 range) = D₉ − D₁ = P₉₀ − P₁₀ Decile deviation (semi-interdecile range) = (D₉ − D₁) / 2 Coefficient of decile deviation = (D₉ − D₁) / (D₉ + D₁)
These mirror the quartile measures exactly: the interquartile range Q₃ − Q₁, the quartile
deviation (Q₃ − Q₁)/2 and its coefficient (Q₃ − Q₁)/(Q₃ + Q₁), with the first and ninth
deciles in place of the quartiles. D₁ and D₉ are found with the usual rules: the k(n + 1)/10th
item for listed values, and Dₖ = L + ((kN/10 − cf)/f) × h for class intervals.
Worked example: continuous series
The calculator opens on this distribution (N = 50):
| Class | f | cf |
|---|---|---|
| 0-10 | 5 | 5 |
| 10-20 | 8 | 13 |
| 20-30 | 12 | 25 |
| 30-40 | 15 | 40 |
| 40-50 | 6 | 46 |
| 50-60 | 4 | 50 |
- D₁: N/10 = 5, reached exactly by the first class. D₁ = 0 + ((5 − 0)/5) × 10 = 10.
- D₉: 9N/10 = 45 falls in 40-50 (cf 46). D₉ = 40 + ((45 − 40)/6) × 10 = 48.333.
- Interdecile range = 48.333 − 10 = 38.333.
- Decile deviation = 38.333/2 = 19.167.
- Coefficient = 38.333/(48.333 + 10) = 38.333/58.333 = 0.6571.
For comparison, the quartile deviation of the same data is 9.479. The decile deviation is about twice as large because it reaches further into the tails.
Worked example: individual series
For 23, 15, 31, 8, 26, 12, 38, 17, 29, 21 (sorted 8, 12, …, 38), D₁ is the
1.1th item, 8 + 0.1 × (12 − 8) = 8.4, and D₉ is the 9.9th item, 31 + 0.9 × (38 − 31) = 37.3.
The decile deviation is (37.3 − 8.4)/2 = 14.45, with coefficient
28.9/45.7 = 0.6324. With only ten values the deciles sit next to the minimum and maximum, so
this measure is best kept for larger data sets.
Reading the result
For a normal distribution, D₁ and D₉ lie 1.2816 standard deviations either side of the mean, so the decile deviation is about 1.28σ and the interdecile range about 2.56σ. If the decile deviation of your data is well below 1.28 times its standard deviation, heavy tails are pulling the standard deviation up; well above it, the data are flatter than a normal curve.
| Measure | Share of data covered | Normal-curve value |
|---|---|---|
| Quartile deviation (Q₃ − Q₁)/2 | Middle 50% | 0.674σ |
| Decile deviation (D₉ − D₁)/2 | Middle 80% | 1.282σ |
| Half the range | All of it | Grows with n |
Common mistakes
- Reporting D₉ − D₁ when the question asks for the decile deviation, or the other way round. Check which definition your book uses.
- Using k(N + 1)/10 with class intervals; grouped data uses kN/10.
- Using class limits for inclusive classes. The calculator converts 10-19, 20-29 to boundaries 9.5-19.5, 19.5-29.5.
Common questions
What is decile deviation?
Half the distance between the ninth and first deciles: (D₉ − D₁)/2. It is
also called the semi-interdecile range. It measures the spread of the middle 80% of the
data, in the same way that the quartile deviation measures the spread of the middle 50%.
What is the coefficient of decile deviation?
(D₉ − D₁)/(D₉ + D₁). Like the coefficient of quartile deviation it has no
units, so it can compare series with different units or averages. For the default grouped
data it is 38.33/58.33 = 0.6571.
Is the interdecile range the same as the 10–90 percentile range?
Yes. D₁ is the 10th percentile and D₉ the 90th, so D₉ − D₁ = P₉₀ − P₁₀. Some books call it the percentile range or the 10–90 range. Halving it gives the decile deviation.
Why use deciles instead of quartiles for dispersion?
The interdecile range covers 80% of the observations instead of 50%, so it says more about the spread of the bulk of the data while still ignoring the most extreme 10% at each end. It is common in income statistics, where the extremes are very far out.
Do all textbooks define decile deviation the same way?
Not quite. Most use (D₉ − D₁)/2 and call D₉ − D₁ the interdecile range; a few quote the range D₉ − D₁ itself as the measure. This page reports both, with the definition printed next to each number, so you can use whichever your book asks for.
Related calculators
-
Decile calculator
Any decile D1 to D9 with the working.
-
Quartile deviation
The same idea for the middle 50%.
-
Percentile calculator
Any percentile of a list of values.
-
Coefficient of range
The spread of all the data, largest to smallest.