Upper and lower fence calculator
Enter your data, or just Q₁ and Q₃, to get the lower and upper fences. With data, the calculator also lists every value outside the fences and where a box plot's whiskers would end.
Separate with commas, spaces or new lines.
Methods differ slightly on small data sets; the fences move with them.
1.5 for the usual (inner) fences, 3 for the outer fences.
The shaded band is Q₁ to Q₃. Highlighted dots lie outside the fences.
Show the working, step by step
Sort the data.
5, 7, 8, 9, 10, 11, 12, 13, 14, 30
Quartiles by median of halves.
lower half: 5, 7, 8, 9, 10 Q₁ = 8 upper half: 11, 12, 13, 14, 30 Q₃ = 13
Interquartile range.
IQR = 13 − 8 = 5
Multiply by k = 1.5.
1.5 × 5 = 7.5
Subtract from Q₁ and add to Q₃.
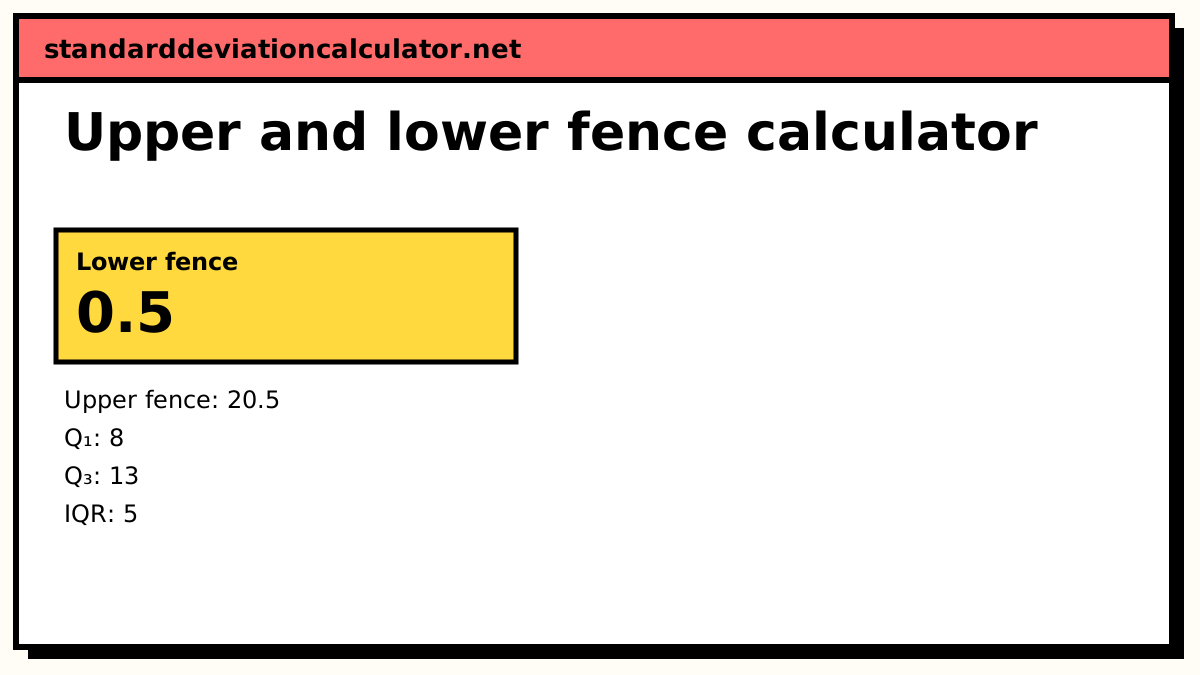
lower fence = 8 − 7.5 = 0.5 upper fence = 13 + 7.5 = 20.5
Values strictly outside the fences are potential outliers. With k = 1.5 they are often called mild outliers, and values beyond k = 3 fences extreme outliers.
The formula
IQR = Q₃ − Q₁ lower fence = Q₁ − k × IQR upper fence = Q₃ + k × IQR (k = 1.5 usually, 3 for outer fences)
A worked example
The default data are ten values: 5, 7, 8, 9, 10, 11, 12, 13, 14, 30. With the median-of-halves method taught with the TI-84:
- The lower half is 5, 7, 8, 9, 10, so Q₁ = 8. The upper half is 11, 12, 13, 14, 30, so Q₃ = 13.
- IQR = 13 − 8 = 5, and 1.5 × IQR = 7.5.
- Lower fence = 8 − 7.5 = 0.5. Upper fence = 13 + 7.5 = 20.5.
- Nothing is below 0.5. The value 30 is above 20.5, so it is a potential outlier. The upper whisker of a box plot would stop at 14, the largest value inside the fence.
If you already have the quartiles, switch to "Q₁ and Q₃ already" and enter 8 and 13: you get the same fences without the data.
Why your textbook's answer may differ
Quartiles have several definitions, and the fences inherit the difference. On the same ten values:
| Quartile method | Q₁ | Q₃ | Lower fence | Upper fence |
|---|---|---|---|---|
| Median of halves (TI-84) | 8 | 13 | 0.5 | 20.5 |
| (n − 1) interpolation (Excel .INC) | 8.25 | 12.75 | 1.5 | 19.5 |
| (n + 1) interpolation (Excel .EXC) | 7.75 | 13.25 | −0.5 | 21.5 |
Here all three flag the same value, but with values close to a fence the method can decide the answer. Choose the one your course or software uses in the quartile menu.
Interpreting the fences
A value outside the fences is unusual relative to the middle half of the data, nothing more. It might be a recording error, or a genuine but rare case. Investigate before removing anything. In skewed data, many legitimate values can land beyond the upper fence, so the rule works best on roughly symmetric data.
Changing the multiplier
With k = 3 the default data give fences of 8 − 15 = −7 and 13 + 15 = 28 (median-of-halves quartiles), so 30 is beyond the outer fence as well: an extreme outlier, not just a mild one. Some quality-control and data-cleaning rules use k = 2 or 2.2 as a middle ground. Whatever value you pick, state it alongside the fences.
Common mistakes
- Adding 1.5 × IQR to the median, or to the maximum, instead of to Q₃.
- Using the range instead of the IQR.
- Reporting the fences as the whisker ends. Whiskers stop at the most extreme data values inside the fences, which are usually not the fences themselves.
Common questions
What are the upper and lower fences?
Cut-off points for outliers: lower fence = Q₁ − 1.5 × IQR and upper fence = Q₃ + 1.5 × IQR. Values outside them are potential outliers. The rule is John Tukey's, and it is the one box plots use to decide where the whiskers stop.
What are inner and outer fences?
The inner fences use 1.5 × IQR, and the outer fences use 3 × IQR. A value between an inner and an outer fence is a mild outlier; a value beyond an outer fence is an extreme outlier. Set the multiplier to 3 to get the outer fences.
Why 1.5?
Tukey chose it as a practical compromise. For normally distributed data the 1.5 × IQR fences sit about 2.7 standard deviations from the mean, so only about 0.7% of values from a normal population fall outside them. Larger multipliers flag fewer values.
Can the lower fence be negative when my data cannot be?
Yes. The fence is only a boundary; if it is below the smallest possible value, it simply means no low value can be an outlier. That is common with right-skewed data such as waiting times or incomes.
Is a value exactly on the fence an outlier?
No. Only values strictly below the lower fence or strictly above the upper fence are flagged.
Related calculators
-
Outlier calculator
Fences plus z-scores, modified z and Grubbs’ test.
-
IQR calculator
The interquartile range the fences are built on.
-
Five-number summary calculator
Min, Q₁, median, Q₃ and max for a box plot.