Median absolute deviation calculator
Paste your data to get the median absolute deviation, a measure of spread that one extreme value cannot distort, plus a modified z-score for each value that picks out the outliers.
Separate with commas, spaces or new lines.
| x | |x − M| | Modified z |
|---|---|---|
| 10 | 4 | −1.349 |
| 12 | 2 | −0.6745 |
| 12 | 2 | −0.6745 |
| 13 | 1 | −0.3372 |
| 14 | 0 | 0 |
| 15 | 1 | 0.3372 |
| 16 | 2 | 0.6745 |
| 18 | 4 | 1.349 |
| 45 | 31 | 10.45 |
Show the working, step by step
Sort the data and find the median.
10, 12, 12, 13, 14, 15, 16, 18, 45 M = 14
Take the absolute deviation of every value from the median, and sort those.
0, 1, 1, 2, 2, 2, 4, 4, 31
The MAD is the median of the absolute deviations.
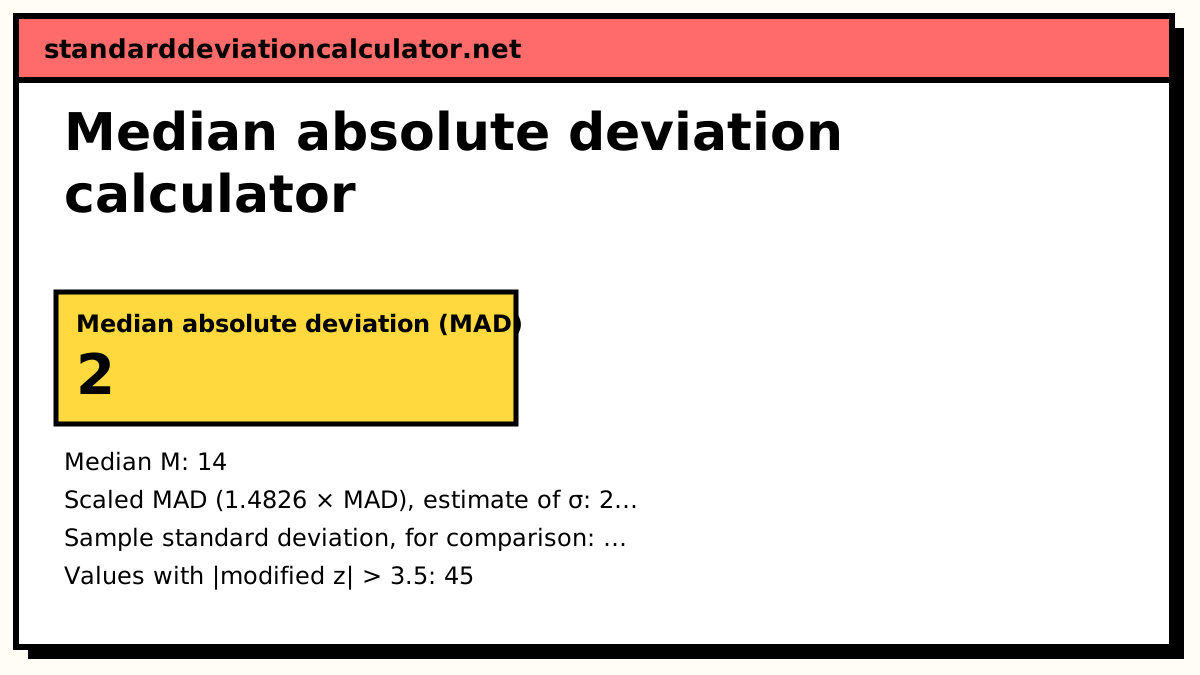
MAD = 2
Multiply by 1.4826 to estimate the standard deviation of normal data.
σ̂ = 1.4826 × 2 = 2.9652
Modified z-score of each value (Iglewicz and Hoaglin); flag |Mi| > 3.5.
Mi = 0.6745 × (x − 14) ÷ 2 x = 18: 0.6745 × 4 ÷ 2 = 1.349 x = 45: 0.6745 × 31 ÷ 2 = 10.45
A single extreme value moves the SD a lot but hardly moves the MAD. Here the SD is 10.69 and the scaled MAD is 2.965.
The formula
MAD = median( |xᵢ − M| ), M = median(x) σ̂ = 1.4826 × MAD modified z: Mᵢ = 0.6745 × (xᵢ − M) ÷ MAD
A worked example
The default data are nine values with one obvious stray: 10, 12, 12, 13, 14, 15, 16, 18, 45.
- The median is the 5th value, M = 14.
- The absolute deviations from 14 are 4, 2, 2, 1, 0, 1, 2, 4, 31. Sorted: 0, 1, 1, 2, 2, 2, 4, 4, 31.
- Their median is the 5th, so MAD = 2.
- The scaled estimate of σ is 1.4826 × 2 = 2.965.
- The modified z-score of 45 is 0.6745 × 31 ÷ 2 = 10.45, far above 3.5. The next largest, 18, scores 0.6745 × 4 ÷ 2 = 1.35.
Compare this with the ordinary sample standard deviation of the same nine values: 10.69. Without the 45 it would be 2.55, so one value has multiplied the SD by about four, while the MAD-based estimate of 2.97 reflects the spread of the other eight values, which really do sit within a few units of 14.
When to use the MAD
Use the MAD when you suspect outliers or heavy tails and want a measure of spread that describes the bulk of the data: sensor readings with occasional glitches, response times with a few very slow requests, prices with a handful of luxury items. Because it is not inflated by the outliers themselves, it is also the better yardstick for finding them. An ordinary z-score measures a value against an SD that the value itself has already stretched, so a big outlier can hide; the modified z-score cannot be fooled that way.
The cost is efficiency. For clean normal data the standard deviation uses the information more fully, and the scaled MAD bounces around more from sample to sample. If the data look normal and have no strays, report the SD.
Common mistakes
- Measuring deviations from the mean instead of the median.
- Reporting the raw MAD as if it were a standard deviation. Multiply by 1.4826 first, and say which one you are quoting, since software differs (R scales by default, some Python functions do not).
- Forgetting the absolute value, which makes half the deviations negative and the median meaningless.
- Deleting every value with |M| > 3.5 automatically. Flagged values need checking, not automatic removal.
Common questions
What is the median absolute deviation?
The median of the distances of each value from the median: MAD = median(|x − M|). It is a measure of spread built entirely from medians, so up to half the data can be wild before it breaks down. That makes it one of the most outlier-resistant measures of spread.
Why multiply the MAD by 1.4826?
For normally distributed data the MAD is about 0.6745 standard deviations, because half of
a normal distribution lies within 0.6745σ of the median. Dividing by 0.6745, which is the same
as multiplying by 1.4826, turns the MAD into an estimate of σ that is directly comparable to a
standard deviation. R's mad() function applies this factor by default.
What is a modified z-score?
M = 0.6745(x − median) ÷ MAD, proposed by Iglewicz and Hoaglin. It is a z-score that uses the median and MAD instead of the mean and standard deviation. They suggest treating values with |M| > 3.5 as potential outliers.
Is the median absolute deviation the same as the mean absolute deviation?
No, though both are often abbreviated MAD. The mean absolute deviation averages the distances from the mean (or median), so a single outlier still pulls it up. The median absolute deviation takes the median of the distances, so it ignores the outlier's size.
What if the MAD is zero?
That happens when more than half the values are identical. Modified z-scores are then undefined (you would divide by zero). Iglewicz and Hoaglin suggest using 1.253314 times the mean absolute deviation in that case, or simply reporting that most of the data are tied.
Related calculators
-
Mean absolute deviation calculator
The average distance from the mean, the other MAD.
-
Outlier calculator
Modified z-scores next to Tukey fences, z-scores and Grubbs.
-
IQR calculator
Another robust measure of spread, from the quartiles.