Index of qualitative variation calculator
Enter each category and how many cases fall in it. The calculator gives the index of qualitative variation, from 0 (no variation) to 1 (cases spread evenly), with the full working.
List every category that could occur, including any with a count of 0: K is the number of categories.
| Category | Count f | Proportion p | p² |
|---|---|---|---|
| Bus | 40 | 0.4 | 0.16 |
| Car | 30 | 0.3 | 0.09 |
| Bike | 20 | 0.2 | 0.04 |
| Walk | 10 | 0.1 | 0.01 |
| Total | 100 | 1 | 0.3 |
Show the working, step by step
Turn each count into a proportion p = f ÷ N.
N = 40 + 30 + 20 + 10 = 100 p(Bus) = 40 ÷ 100 = 0.4 p(Car) = 30 ÷ 100 = 0.3 p(Bike) = 20 ÷ 100 = 0.2 p(Walk) = 10 ÷ 100 = 0.1
Square the proportions and add them.
Σp² = 0.16 + 0.09 + 0.04 + 0.01 = 0.3
Subtract from 1 to get the diversity index.
1 − Σp² = 1 − 0.3 = 0.7
Divide by its maximum, 1 − 1/K, by multiplying by K/(K − 1).
IQV = (4/3) × 0.7 = 0.9333
The same answer from the counts directly:
IQV = K(N² − Σf²) ÷ (N²(K − 1)) = 4 × (10000 − 3000) ÷ (10000 × 3) = 0.9333
IQV runs from 0 (every case in one category) to 1 (the same number of cases in every category). It depends on K, so compare IQVs only between variables with the same list of categories.
The formula
IQV = (K ÷ (K − 1)) × (1 − Σp²) = K(N² − Σf²) ÷ (N²(K − 1))
K is the number of categories, N the total number of cases, f the count in a category and p = f ÷ N its proportion. 1 − Σp² measures how spread out the cases are; multiplying by K ÷ (K − 1) rescales it so the most even spread possible scores exactly 1.
A worked example
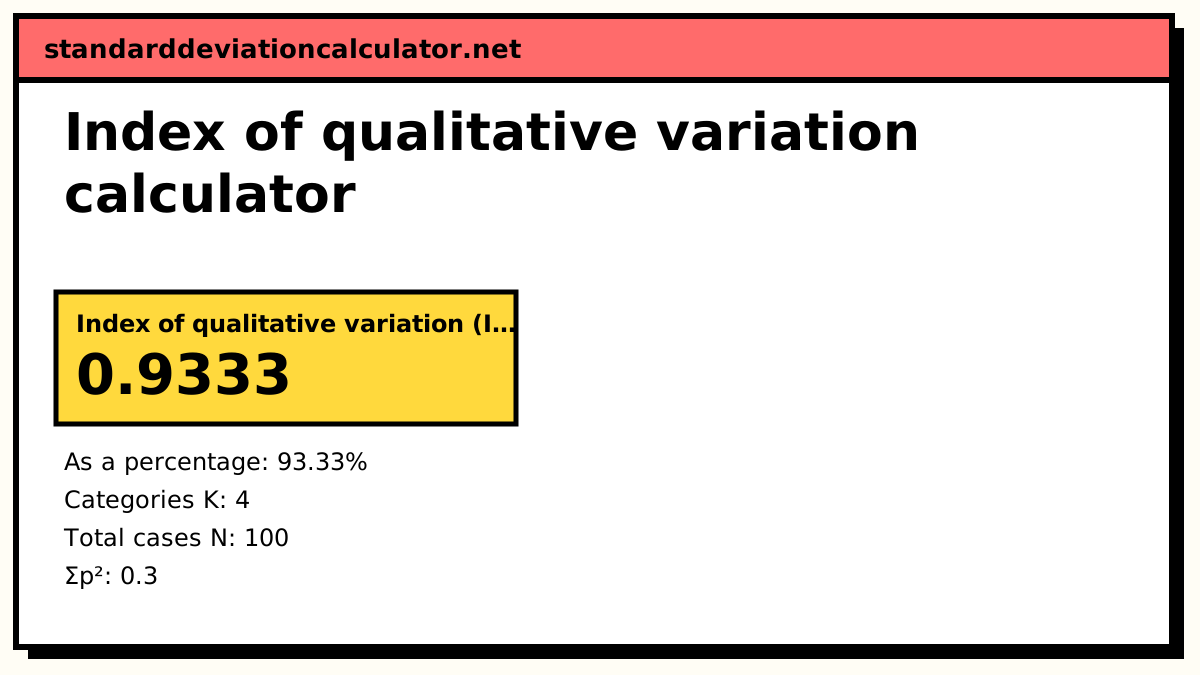
The default data are how 100 commuters travel to work: 40 by bus, 30 by car, 20 by bike and 10 on foot. There are K = 4 categories and N = 100 cases.
| Mode | f | p | p² |
|---|---|---|---|
| Bus | 40 | 0.4 | 0.16 |
| Car | 30 | 0.3 | 0.09 |
| Bike | 20 | 0.2 | 0.04 |
| Walk | 10 | 0.1 | 0.01 |
| Total | 100 | 1 | 0.30 |
1 − Σp² = 1 − 0.30 = 0.70 IQV = (4 ÷ 3) × 0.70 = 0.9333
From the counts directly: 4 × (10,000 − 3,000) ÷ (10,000 × 3) = 28,000 ÷ 30,000 = 0.9333, the same answer. The largest possible 1 − Σp² with four categories is 1 − 1/4 = 0.75, and 0.70 is 93% of that.
Interpreting the IQV
An IQV of 0.93 says the commuters are spread across the four modes almost as evenly as possible, even though bus is the most common choice. If all 100 took the bus, Σp² would be 1 and the IQV 0. If 25 used each mode, Σp² would be 0.25 and the IQV exactly 1.
IQV is useful for comparing groups on the same categorical variable: the religious diversity of two cities, the mix of majors in two year groups, or how the spread of answers to a survey question changed between two years. It says nothing about which category is most common. Pair it with the mode for that.
Common mistakes
- Forgetting the K ÷ (K − 1) factor. Without it you have the diversity index, which cannot reach 1.
- Leaving out categories that had no cases, which lowers K and inflates the IQV.
- Using IQV on ordinal or numeric data, where measures that respect order (IQR, standard deviation) say more.
- Comparing IQVs from variables with different numbers of categories.
Common questions
What is the index of qualitative variation?
A measure of spread for nominal (categorical) data, where a standard deviation makes no sense. It compares how evenly the cases are spread over the categories with the most even spread possible. IQV = 0 when every case is in one category and 1 when every category has the same number of cases.
What is the formula for IQV?
IQV = (K ÷ (K − 1)) × (1 − Σp²), where K is the number of categories and p is the proportion of cases in each. Written with counts, IQV = K(N² − Σf²) ÷ (N²(K − 1)). Both give the same number.
What is a good IQV?
There is no good or bad value; it depends on the question. A value near 1 means the population is diverse on that variable, and a value near 0 means it is homogeneous. The calculator's wording (low, moderate, high) is a rough guide, not a standard cut-off.
How is IQV related to the Gini–Simpson or Blau index?
1 − Σp² is the Gini–Simpson diversity index (also called Blau's index): the chance that two cases picked at random, with replacement, fall in different categories. Its largest possible value with K categories is 1 − 1/K. The IQV divides by that maximum, so it always runs from 0 to 1 whatever K is.
Should I include categories with zero cases?
Yes, if they are real possible answers. K counts every category in the variable's definition. Adding an empty category raises K and so changes the IQV, which is why you should compare IQVs only between variables coded with the same categories.
Related calculators
-
Mode calculator
The typical category of nominal data.
-
Chi-square calculator
Test whether category counts match an expected pattern.
-
Dispersion calculator
Every measure of spread for numeric data.