Statistics
Mode calculator
The mode is the most frequent value. Enter a list to see every mode and a frequency count, or a frequency table or class intervals to find the mode by inspection, by the grouping method, or by the modal class formula.
Separate with commas, spaces or new lines.
| Value | Frequency |
|---|---|
| 1 | 1 |
| 2 | 1 |
| 3 | 1 |
| 5 | 3 |
| 7 | 3 |
| 9 | 1 |
Show the working, step by step
Count how often each distinct value occurs (the frequency table).
1: 1 2: 1 3: 1 5: 3 7: 3 9: 1
Find the highest count: 3.
2 values reach it, so the data are bimodal.
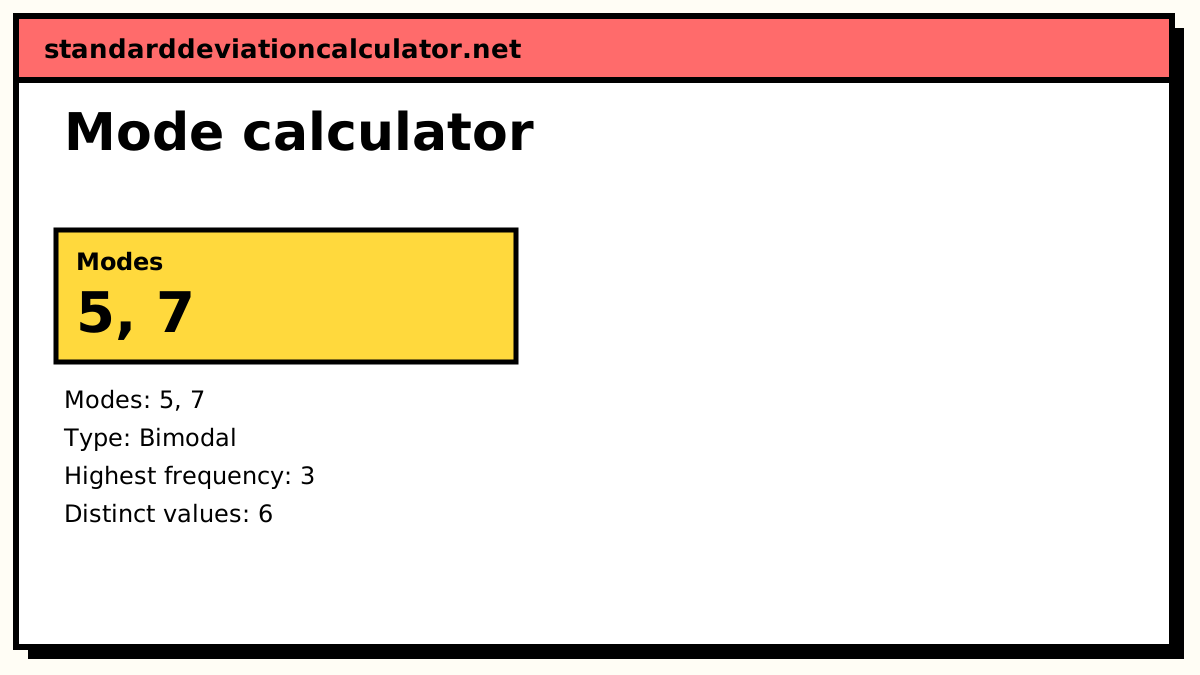
Modes = 5, 7
Mode of a list
Count how often each value occurs and pick the value (or values) with the highest count. The default list, 3, 7, 5, 7, 2, 9, 5, 7, 5, 1, has 5 and 7 three times each and every other value once, so it is bimodal with modes 5 and 7. The list 1, 2, 3 has no mode, because no value occurs more often than the others.
Mode of a discrete series
By inspection, the mode is the x with the largest frequency. That can mislead when the frequencies are irregular or two peaks are close. The grouping method, taught in CBSE Class 11 economics, checks the frequencies in groups:
| Column | What it holds |
|---|---|
| I | The frequencies as given |
| II | Sums of two, starting from the first row |
| III | Sums of two, starting from the second row |
| IV | Sums of three, starting from the first row |
| V | Sums of three, starting from the second row |
| VI | Sums of three, starting from the third row |
In each column, mark the largest total and the rows that make it up. An analysis table then counts the marks for each value. For x = 10 to 19 with f = 8, 15, 20, 100, 98, 97, 40, 30, 20, 10 (switch the calculator to “Discrete series” and “Grouping method”), the largest totals are 100 (13), 195 (14 + 15), 198 (13 + 14), 295 (13 + 14 + 15), 235 (14 + 15 + 16) and 218 (12 + 13 + 14). The value 14 is marked 5 times against 4 for 13, so the mode is 14, not the 13 that inspection suggests.
Mode of grouped data
Mode = L + ((f₁ − f₀) ÷ (2f₁ − f₀ − f₂)) × h
With classes 0–10 up to 70–80 and frequencies 5, 8, 7, 12, 28, 20, 10, 10, the modal class is 40–50 (f₁ = 28). The class before has f₀ = 12 and the one after has f₂ = 20, and h = 10:
Mode = 40 + ((28 − 12) ÷ (56 − 12 − 20)) × 10 = 40 + (16 ÷ 24) × 10 = 46.67
The mode lands in the upper part of the class because the class after (20) is fuller than the class before (12). When two classes tie for the highest frequency, use the grouping method to choose the modal class, then apply the formula to it.
Common mistakes
- Reporting the highest frequency (28) instead of the mode.
- Picking one mode when two values tie; both are modes.
- Using class limits instead of boundaries when classes are inclusive (10–19, 20–29). The calculator converts them for you.
- Applying the formula when classes have unequal widths, without first adjusting the frequencies.
Common questions
What is the mode?
The value that occurs most often. In 3, 7, 5, 7, 2, 9, 5, 7, 5, 1 both 5 and 7 occur three times, so the data have two modes, 5 and 7. For grouped data the mode is estimated inside the class with the highest frequency.
What is the difference between unimodal, bimodal and multimodal?
Unimodal data have one most frequent value, bimodal data two tied values, trimodal three, and multimodal data several. If every value occurs equally often there is no mode at all.
What is the grouping method for the mode?
A check used when the highest frequency is not clearly ahead of its neighbours. The frequencies are added in twos and threes in six columns; the largest total in each column marks the values (or classes) that make it up, and the one marked most often in the analysis table is the mode. For x = 10 to 19 with f = 8, 15, 20, 100, 98, 97, 40, 30, 20, 10, inspection says 13 (f = 100), but the grouping method gives 14, because 14 is surrounded by large frequencies.
How do I find the mode of grouped data?
Find the modal class (the highest frequency f₁), then use
Mode = L + ((f₁ − f₀) ÷ (2f₁ − f₀ − f₂)) × h, with f₀ and f₂ the frequencies of
the classes before and after it. For the table on this page the modal class is 40–50 and the
mode is 40 + (16 ÷ 24) × 10 = 46.67.
Can the mode be used for non-numeric data?
Yes, and it is the only one of the three averages that can: the most common blood group, shoe size or answer to a survey question is a mode. This calculator works with numbers, but the counting is the same.
Related calculators
-
Median and mode
Both measures for grouped data, with the empirical check.
-
Mean, median, mode, range
All four from a list, with working.
-
Mean of a series
Direct, short-cut and step-deviation methods.
-
Histogram maker
See the peak of your data as a chart.