Statistics
Median and mode calculator for grouped and ungrouped data
Find the median and the mode together, for raw data, a frequency table or class intervals. The calculator builds the cumulative frequency column, picks out the median and modal classes, and checks the result against Karl Pearson's empirical relation.
Separate with commas, spaces or new lines.
Red lines: the median (half the data on each side), the mode (the peak) and the mean (the balance point). How far apart they sit shows the skew. Solid bar: the modal class.
| Class | f | Cumulative f | |
|---|---|---|---|
| 10–20 | 4 | 4 | |
| 20–30 | 10 | 14 | |
| 30–40 | 16 | 30 | median class, modal class |
| 40–50 | 12 | 42 | |
| 50–60 | 8 | 50 |
Show the working, step by step
Median: N = 50, so N ÷ 2 = 25. The first cumulative frequency to reach 25 is 30, so the median class is 30–40.
L = 30, cf = 14 (cumulative f before the class), f = 16, h = 10
Substitute into Median = L + ((N/2 − cf) ÷ f) × h.
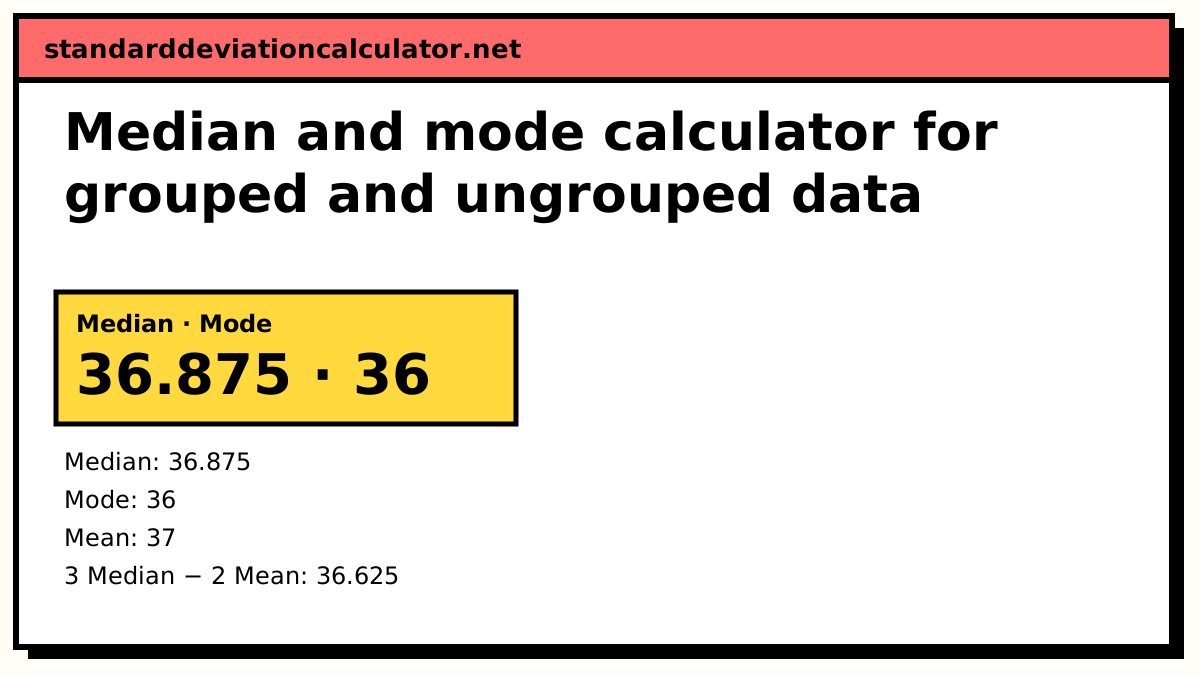
Median = 30 + ((25 − 14) ÷ 16) × 10 = 30 + 6.875 = 36.875
Mode: the highest frequency is 16, so the modal class is 30–40.
L = 30, f₁ = 16, f₀ = 10 (class before), f₂ = 12 (class after), h = 10
Substitute into Mode = L + ((f₁ − f₀) ÷ (2f₁ − f₀ − f₂)) × h.
Mode = 30 + ((16 − 10) ÷ (32 − 10 − 12)) × 10 = 30 + 6 = 36
Mean for the check, from the class mid-values: Σfx ÷ N.
x̄ = 1850 ÷ 50 = 37
Empirical relation: Mode ≈ 3 Median − 2 Mean.
3 × 36.875 − 2 × 37 = 36.625, against 36 from the formula (a difference of 0.625)
Grouped median and mode assume the values in each class are spread evenly across it, so they estimate the median and mode of the raw data.
The formulas for a continuous series
Median = L + ((N/2 − cf) ÷ f) × h Mode = L + ((f₁ − f₀) ÷ (2f₁ − f₀ − f₂)) × h Check: Mode ≈ 3 Median − 2 Mean
In the median formula L, f and h belong to the median class and cf is the cumulative frequency before it. In the mode formula L, f₁ and h belong to the modal class, and f₀ and f₂ are the frequencies either side of it.
A worked example (the default data)
| Class | f | Cumulative f |
|---|---|---|
| 10–20 | 4 | 4 |
| 20–30 | 10 | 14 |
| 30–40 | 16 | 30 |
| 40–50 | 12 | 42 |
| 50–60 | 8 | 50 |
Median. N = 50, so N/2 = 25. The cumulative frequency first reaches 25 in the class 30–40 (cf climbs from 14 to 30). With L = 30, cf = 14, f = 16 and h = 10:
Median = 30 + ((25 − 14) ÷ 16) × 10 = 30 + 6.875 = 36.875
Mode. The largest frequency, 16, is also in 30–40. With f₀ = 10 and f₂ = 12:
Mode = 30 + ((16 − 10) ÷ (32 − 10 − 12)) × 10 = 30 + 6 = 36
Check. The mean from the mid-values is 1,850 ÷ 50 = 37, and 3 × 36.875 − 2 × 37 = 36.625. That is within 0.625 of the formula's 36, so the answers are consistent. The median and the modal class need not be the same class; here they happen to coincide.
Discrete and individual series
Discrete series (x = 1, 2, 3, 4, 5 with f = 4, 9, 14, 8, 5): N = 40 and the cumulative frequencies are 4, 13, 27, 35, 40. The 20th and 21st items both fall where cf first passes 13, at x = 3, so the median is 3. The largest frequency, 14, is also at x = 3, so the mode is 3.
Individual series (7, 3, 9, 4, 7, 12, 5, 7, 10): sorted, the 5th of 9 values is 7, and 7 occurs three times, so the median and mode are both 7.
Inclusive classes
If the table reads 10–19, 20–29, 30–39, … there is a gap of 1 between one class and the next. The formulas need touching classes, so L becomes 29.5 rather than 30 for the class 30–39. With the same frequencies as above the median becomes 36.375 and the mode 35.5: each answer moves down by exactly 0.5. Forgetting this step is the most common reason a textbook answer does not match.
Common mistakes
- Using the cumulative frequency of the median class for cf, instead of the one before it.
- Taking f₀ and f₂ from the classes next to the median class rather than the modal class.
- Using class limits instead of boundaries for inclusive classes.
- Applying the mode formula to unequal class widths without adjusting the frequencies first.
Common questions
What is the formula for the median of grouped data?
Median = L + ((N/2 − cf) ÷ f) × h, where L is the lower boundary of the median
class, N the total frequency, cf the cumulative frequency of the class before it, f the
frequency of the median class and h its width. The median class is the first class whose
cumulative frequency reaches N/2.
What is the formula for the mode of grouped data?
Mode = L + ((f₁ − f₀) ÷ (2f₁ − f₀ − f₂)) × h, where the modal class is the one
with the highest frequency f₁, f₀ and f₂ are the frequencies of the classes just before and
after it, L is its lower boundary and h its width.
What is the empirical relation between mean, median and mode?
For moderately skewed, single-peaked distributions, Karl Pearson observed that
Mode ≈ 3 Median − 2 Mean. It is an approximation, not an identity. For the
default table it gives 36.625 against 36 from the mode formula. Textbooks use it to find one
measure when the other two are known.
Should I use N/2 or (N + 1)/2 to find the median class?
For a continuous series use N/2: the formula treats the data as spread evenly through each class, so there is no “item number” to add 1 to. For a discrete series the median is the (N + 1)/2th item, found from the cumulative frequency column; with an even N that means the average of the N/2th and (N/2 + 1)th items.
What do I do with classes like 10–19, 20–29?
Those are inclusive classes with a gap of 1 between them. Convert them to boundaries by subtracting 0.5 from each lower limit and adding 0.5 to each upper limit (9.5–19.5, 19.5–29.5, …) before using L and h. The calculator detects the gap and does this automatically.
Related calculators
-
Mean of a series
Direct, short-cut and step-deviation methods for the same tables.
-
Mode calculator
Modes of lists and tables, including the grouping method.
-
Median calculator
The median of a plain list, with quartiles.
-
Quartile calculator
Q1 and Q3 by the same cumulative-frequency method.
-
Mean, median, mode, range
All four for a list, with working.