Statistics
Mean, median, mode and range calculator
Enter a list of numbers to get all four of the usual summaries, each worked out the way a homework answer sets it out: sort, then add and divide, find the middle, count the repeats, and subtract the ends.
Separate with commas, spaces or new lines.
| Value | Count |
|---|---|
| 2 | 1 |
| 3 | 1 |
| 4 | 1 |
| 5 | 2 |
| 6 | 1 |
| 8 | 3 |
| 9 | 1 |
| 10 | 1 |
Show the working, step by step
Sort the data from smallest to largest.
2, 3, 4, 5, 5, 6, 8, 8, 8, 9, 10
Mean: add the values and divide by how many there are.
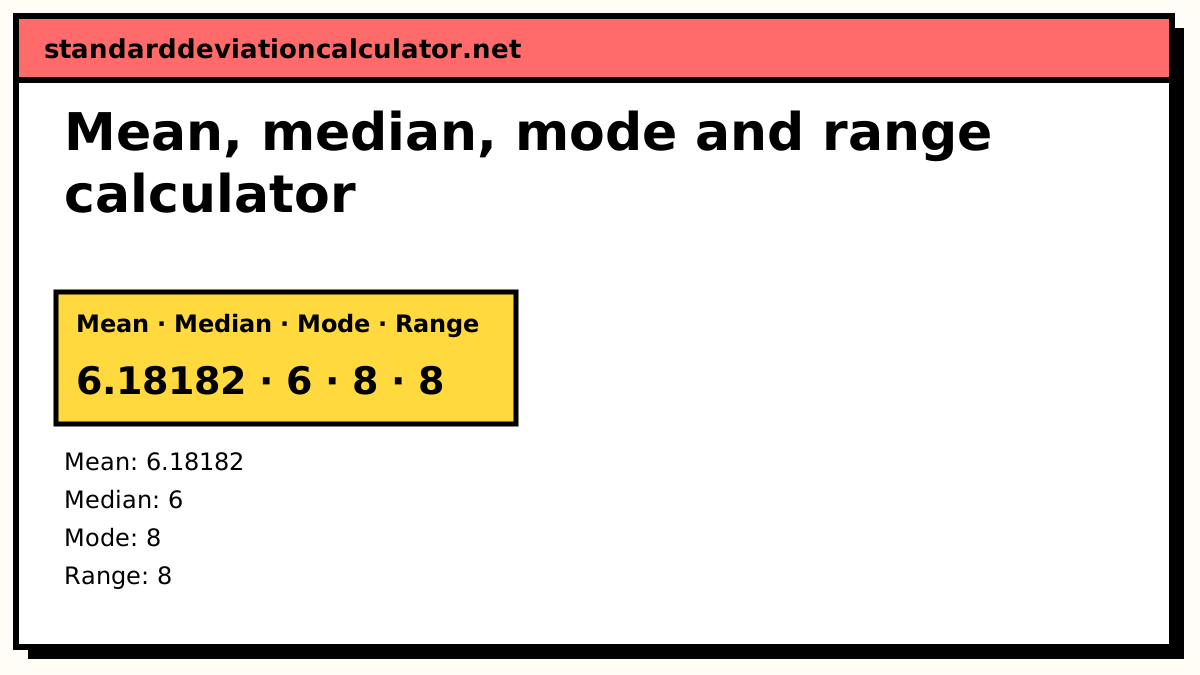
x̄ = Σx ÷ n = 68 ÷ 11 = 6.18182
Median: n = 11 is odd, so the median is the (n + 1) ÷ 2 = 6th value.
median = 6
Mode: count how often each value occurs (see the table). The highest count is 3, reached by 8. The data are unimodal (one mode).
mode = 8
Range: largest value minus smallest value.
range = 10 − 2 = 8
The mean is above the median, a sign that a few large values pull the data to the right (positive skew).
The four definitions
Mean x̄ = Σx ÷ n Median the ((n + 1) ÷ 2)th value of the sorted list Mode the value(s) with the highest frequency Range largest − smallest
A worked example (the default list)
The data are 4, 8, 6, 5, 3, 8, 9, 5, 8, 10, 2.
- Sort: 2, 3, 4, 5, 5, 6, 8, 8, 8, 9, 10. There are n = 11 values.
- Mean: the sum is 68, so x̄ = 68 ÷ 11 = 6.18 (6.1818…).
- Median: n is odd, so take the (11 + 1) ÷ 2 = 6th value: 6.
- Mode: 8 appears three times, more than any other value: 8.
- Range: 10 − 2 = 8.
Here the mode and the range happen to be the same number, which is a coincidence. The mean sits a little above the median, a mild sign that the larger values are more spread out than the smaller ones.
Even counts and several modes
With an even number of values there is no single middle one. For 3, 7, 5, 7, 2, 9, 5, 7, 5, 1 (sorted: 1, 2, 3, 5, 5, 5, 7, 7, 7, 9) the 5th and 6th values are 5 and 5, so the median is 5. The mean is 51 ÷ 10 = 5.1, the range is 9 − 1 = 8, and both 5 and 7 occur three times, so the data are bimodal with modes 5 and 7.
What each measure is good for
| Measure | Tells you | Weakness |
|---|---|---|
| Mean | The balance point; uses every value | Pulled by outliers |
| Median | The middle; half the data lie on each side | Ignores how far out the extremes are |
| Mode | The most common value; works for categories | May not exist, or may not be unique |
| Range | The full spread of the data | Set entirely by the two most extreme values |
How one outlier moves each measure
Change the 10 in the default list to 100. The sum becomes 158, so the mean jumps from 6.18 to 14.36, and the range from 8 to 98. The median stays at 6 and the mode stays at 8, because neither depends on how far out the largest value is. When the mean and the median disagree sharply, look for an outlier or a long tail before choosing which one to report.
Common mistakes
- Taking the middle of the unsorted list as the median.
- Reporting the frequency of the mode (3) instead of the mode itself (8).
- Giving the range as “2 to 10”. The range is one number, 10 − 2 = 8.
- Picking just one mode when two values tie.
For data given as a frequency table or in class intervals, use the median and mode calculator for grouped data or the mean calculator for series.
Common questions
How do I find the mean, median, mode and range?
Sort the numbers first. The mean is the sum divided by the count. The median is the middle value (or the average of the two middle values). The mode is the value that occurs most often. The range is the largest value minus the smallest. For 4, 8, 6, 5, 3, 8, 9, 5, 8, 10, 2 they are 6.18, 6, 8 and 8.
What if two values tie for the most frequent?
Then both are modes and the data are bimodal. For 3, 7, 5, 7, 2, 9, 5, 7, 5, 1, both 5 and 7 occur three times, so the modes are 5 and 7. Three tied values make the data trimodal; more than that is usually just called multimodal.
When is there no mode?
When every value occurs the same number of times: 2, 4, 6, 8 has no mode, and nor does 1, 1, 2, 2, 3, 3. Some teachers write “no mode”, others say every value is a mode; the first is the usual convention and the one used here.
Can the median be a number that is not in the data?
Yes, when the count is even. The median of 3, 7, 8, 12 is (7 + 8) ÷ 2 = 7.5. The mean can also fall between data values; only the mode is always one of the values.
Which of the four should I report?
Report a centre and a spread together. For roughly symmetric data the mean and the range (or better, the standard deviation) are standard. For skewed data such as incomes, the median is the fairer centre. The mode suits categories and counts, such as the most common shoe size.
Related calculators
-
Median and mode (grouped)
The same measures for frequency tables and class intervals.
-
Mode calculator
Modes of lists and tables, including the grouping method.
-
Range calculator
The range and the coefficient of range on their own.
-
Descriptive statistics
Every summary at once, with the standard deviation.