Median calculator
Enter your numbers to get the median, with the sorted list and the middle position shown. The mean is reported beside it; the gap between the two is the quickest read on whether your data is skewed.
Separate numbers with commas, spaces or new lines, or paste a spreadsheet column.
Decimals and negatives are fine; write 10:3 for a value that occurs 3 times.
Your results will appear here: the result first, then the rest of the summary and a chart.
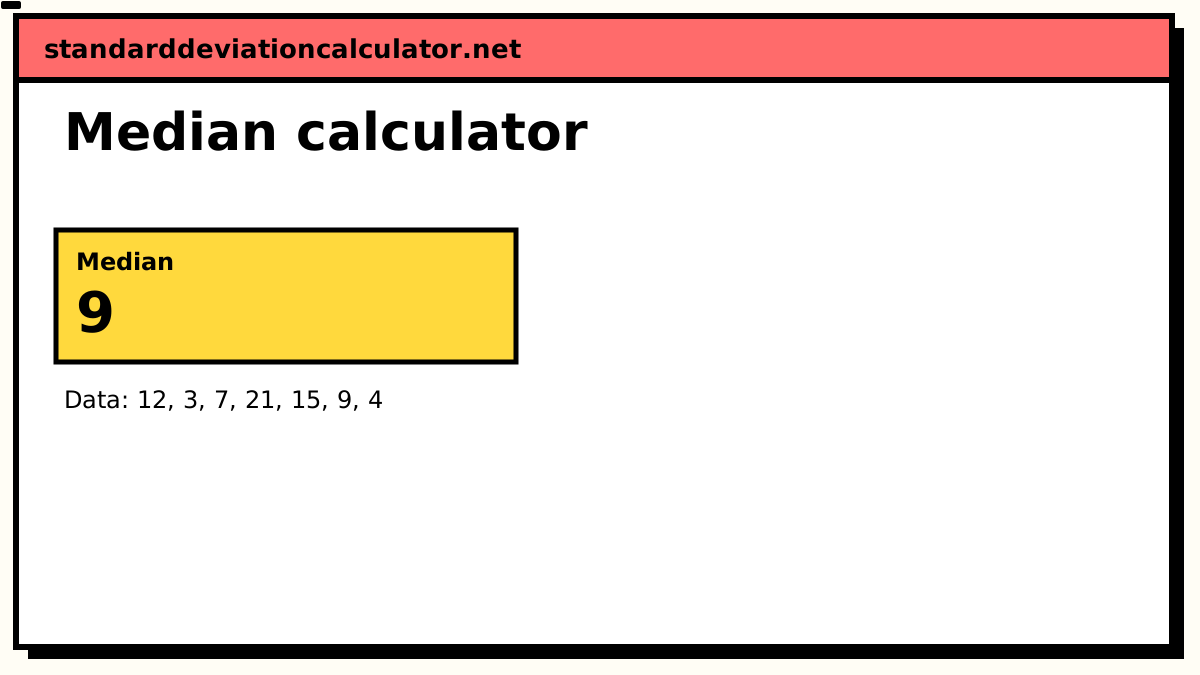
Median
9
Data distribution
Shaded bands mark ±1, ±2 and ±3 SD from the mean. 5 of 7 values (71%) fall within ±1 SD.
Chart as text
Mean 10.1429, sample standard deviation s = 6.38823, from 7 values between 3 and 21.
- Within ±1 SD (3.755 to 16.53): 5 of 7 values (71%). About 68% for normal data.
- Within ±2 SD: 7 (100%). About 95% for normal data.
- Within ±3 SD: 7 (100%). About 99.7% for normal data.
Show the working, step by step
How the median is found
Sort the values, then take the middle position. Which position that is depends on the count:
-
Odd n: the median sits at position
(n + 1) ÷ 2. With 7 values that is the 4th. -
Even n: there is no single middle, so average the values at positions
n ÷ 2andn ÷ 2 + 1. With 8 values, average the 4th and the 5th.
Median: a worked example
Seven values: 12, 3, 7, 21, 15, 9, 4.
- Sorted: 3, 4, 7, 9, 12, 15, 21
- Count: 7, so the median is at position (7 + 1) ÷ 2 = 4
- Median: 9
Add one more value (say 100) and the sorted list becomes
3, 4, 7, 9, 12, 15, 21, 100. The median moves only from 9 to 10.5, while the mean
jumps from 10.1 to 21.4. That is the robustness of the median in one line.
Why the median resists outliers
The mean uses the magnitude of every value. The median uses only their order. Replacing the largest value with one ten times larger does not change its position in the sorted list, so the median does not move at all.
| Data | Mean | Median |
|---|---|---|
| 38, 41, 44, 47, 52 | 44.4 | 44 |
| 38, 41, 44, 47, 480 | 130 | 44 |
| 38, 41, 44, 47, 4800 | 994 | 44 |
The mean triples, then multiplies eightfold. The median does not move once. Statisticians call this a breakdown point: the median tolerates up to half the data being arbitrarily corrupted before it becomes meaningless, while a single bad value is enough to send the mean anywhere.
When the mean is the better choice
Robustness is not free. The median throws away information (it ignores every value except the one or two in the middle), and that costs precision when the data is well behaved:
- Symmetric data. On roughly normal data the mean is the more efficient estimator: it varies less from sample to sample, so it pins down the centre more tightly.
- When totals matter. The mean multiplied by the count gives the sum. The median tells you nothing about the total, so budgets, capacity and cost planning need the mean.
- Further statistics. The standard deviation, the variance and most inferential tests are all built on the mean.
Median, quartiles and the box plot
The median splits the data in half. Applying the same idea to each half gives the quartiles: Q1 is the median of the lower half, Q3 the median of the upper. Those three numbers plus the minimum and maximum are the five-number summary, and drawing them is exactly what a box plot does. The interquartile range, Q3 − Q1, is the median's natural companion measure of spread, robust for the same reason the median is.
Common questions
How do you find the median?
Sort the values from smallest to largest, then take the middle one. With an odd count there is a single middle value. With an even count there are two, and the median is their average.
Sorting first is not optional: the median is defined by position, so it cannot be found until the data is in order.
What is the median of an even number of values?
The average of the two middle values. For 3, 7, 8, 12 the middle pair is 7
and 8, so the median is 7.5. Note that the median then need not be a number that appears in
the data at all, which is perfectly normal.
Why use the median instead of the mean?
Because the median ignores how extreme the extreme values are. It only cares about their position in the order, so a single enormous value moves it barely at all while it drags the mean substantially.
That robustness is why incomes, house prices, response times and survival times are reported as medians. Each has a long right tail that would otherwise pull the average somewhere no typical case sits.
Is the median the same as the second quartile?
Yes. The median is Q2, the 50th percentile, and the middle line of a box plot: four names for the same number. It splits the data into a lower half and an upper half, and the interquartile range measures the spread of the middle half around it.
Can a dataset have two medians?
No. Unlike the mode, the median is always unique. With an even count you average the two middle values into a single number rather than reporting both.
What does it mean when the mean and median are far apart?
The data is skewed. If the mean is above the median, a tail of large values is pulling it up, the usual pattern for incomes and waiting times. If the mean is below, a tail of small values is pulling it down. When the two nearly coincide, the distribution is roughly symmetric. This calculator reports both so the comparison is immediate.
Related calculators
-
Average calculator
The arithmetic mean, with the sum and count shown.
-
Mean, median and mode
All three averages plus the range.
-
IQR calculator
The spread of the middle half, around the median.
-
Five-number summary
Minimum, quartiles, median and maximum.