Average calculator
The mean, or average, is the sum of the values divided by how many there are. Paste or type your numbers to get it, with the sum and the count that produced it. The median, mode and standard deviation of the same data are shown underneath, because the average on its own rarely tells the whole story. For two numbers, add them and halve the total: the average of 84 and 100 is 184 ÷ 2 = 92.
Separate numbers with commas, spaces or new lines, or paste a spreadsheet column.
Decimals and negatives are fine; write 10:3 for a value that occurs 3 times.
Your results will appear here: the result first, then the rest of the summary and a chart.
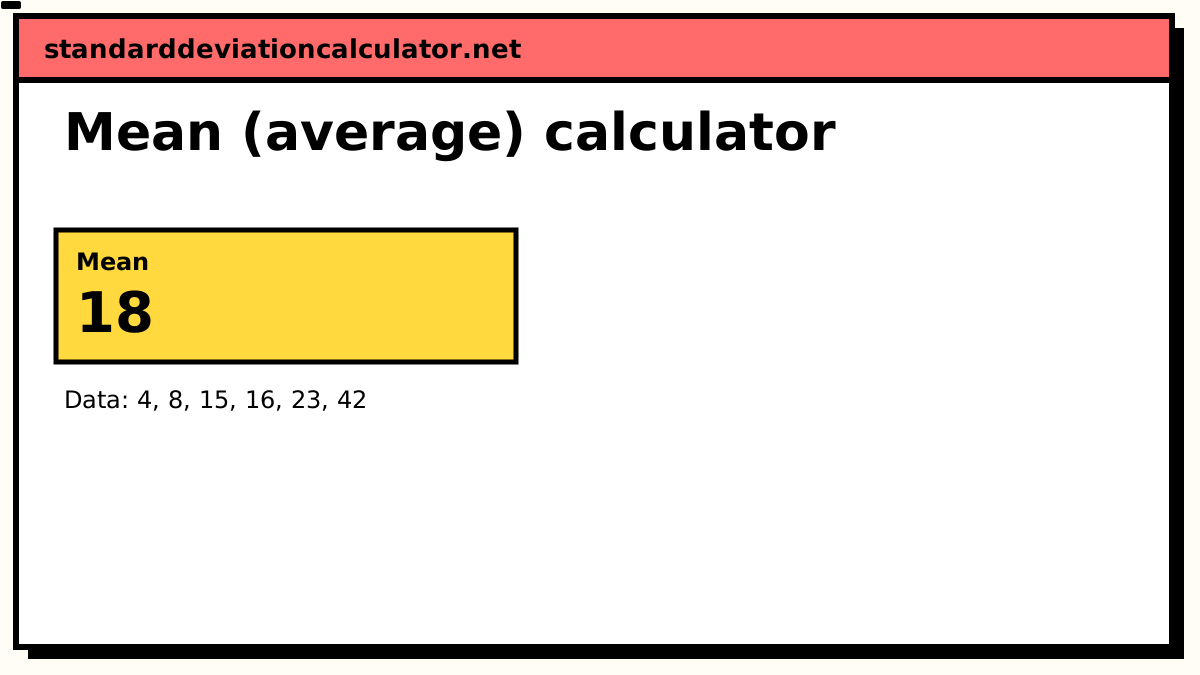
Mean (average)
18
Data distribution
Shaded bands mark ±1, ±2 and ±3 SD from the mean. 4 of 6 values (67%) fall within ±1 SD.
Chart as text
Mean 18, sample standard deviation s = 13.4907, from 6 values between 4 and 42.
- Within ±1 SD (4.509 to 31.49): 4 of 6 values (67%). About 68% for normal data.
- Within ±2 SD: 6 (100%). About 95% for normal data.
- Within ±3 SD: 6 (100%). About 99.7% for normal data.
Show the working, step by step
Average formula
The arithmetic mean is the sum of the values divided by how many there are:
x̄ = Σx ÷ n
Σx is the sum of every value, n is the count, and x̄
("x-bar") is the conventional symbol for a sample mean. A population mean is written
μ ("mu"). The arithmetic is identical; the symbol only records whether the
numbers are all of the group or a sample drawn from it.
Average: a worked example
Six delivery times, in minutes: 4, 8, 15, 16, 23, 42.
- Sum: 4 + 8 + 15 + 16 + 23 + 42 = 108
- Count: 6
- Average: 108 ÷ 6 = 18 minutes
Now look at the data again. Only two of the six deliveries took longer than 18 minutes, and the 42 is doing most of the work. The median is 15.5, a better description of a typical delivery. Neither number is wrong; they answer different questions.
The average of two numbers
For two numbers the average is simply the point halfway between them: add them and divide by 2.
| Numbers | Working | Average |
|---|---|---|
| 68 and 100 | (68 + 100) ÷ 2 = 168 ÷ 2 | 84 |
| 65 and 100 | (65 + 100) ÷ 2 = 165 ÷ 2 | 82.5 |
| 65 and 80 | (65 + 80) ÷ 2 = 145 ÷ 2 | 72.5 |
The order does not matter: the average of 100 and 68 is also 84. If the two numbers should not count equally (a test worth 70% and one worth 30%, say), you need the weighted average instead.
Why the average alone is not enough
Two datasets can share an average and behave completely differently:
| Data | Mean | Standard deviation |
|---|---|---|
| 50, 50, 50, 50 | 50 | 0 |
| 48, 49, 51, 52 | 50 | 1.83 |
| 0, 25, 75, 100 | 50 | 43.3 |
All three average 50. The third is wildly inconsistent and the first is perfectly uniform, and the average cannot tell them apart. This is why an average is normally quoted with a standard deviation beside it: one says where the data sits, the other says how tightly it clusters there.
Averages that are not the mean
The arithmetic mean is the right tool for most measurements, but not all. The calculator above also reports the geometric, harmonic and 10% trimmed means and the root mean square of the same values, so you can compare them directly:
- Rates of growth need the geometric mean. Averaging annual returns of +50% and −50% arithmetically gives 0%, but 100 becomes 150 then 75: an actual loss.
- Speeds over a fixed distance need the harmonic mean. Driving out at 30 mph and back at 60 mph averages 40 mph over the round trip, not 45.
-
A few extreme values can be handled with a trimmed mean, which
drops the same share of values from each end before averaging. The 10% trimmed mean here
removes ⌊0.1 × n⌋ values from each end, so with fewer than 10 values it removes none and
equals the ordinary mean. Excel's
TRIMMEAN(range, 0.2)is the same thing, because Excel takes the total fraction rather than the fraction per end. - Skewed data is usually better summarised by the median, which is why incomes and house prices are always reported that way.
- Categories have no mean at all. The most common value, the mode, is the only average available.
Averaging averages
A common and expensive mistake. If one class of 10 students averages 80 and another of 30 averages 60, the overall average is not 70. It is:
(10 × 80 + 30 × 60) ÷ 40 = 2600 ÷ 40 = 65
Averaging the two averages treats the small class as though it were the same size as the large one. Averages can only be combined if you weight each by its own count, which is what a weighted average does.
Common questions
What is the average of a set of numbers?
In ordinary use "average" means the arithmetic mean: add every value
and divide by how many there are. For 4, 8, 15, 16, 23, 42 the sum is 108 and
the count is 6, so the mean is 108 ÷ 6 = 18.
Strictly, "average" is a looser word than "mean"; the median and the mode are averages too. When a number is labelled "the average" with no qualifier, it is almost always the arithmetic mean.
How do I calculate an average by hand?
Three steps: add the values to get the sum, count how many values there are, then divide
the sum by the count. The only common mistakes are miscounting, and forgetting that repeated
values each count separately: in 7, 7, 9 the count is 3, not 2.
When is the average misleading?
Whenever the data is skewed or holds outliers. The mean uses every value in full, so one extreme number drags it. Nine salaries of about 45,000 alongside one of 480,000 give a mean of roughly 88,500, higher than nine of the ten people actually earn. The median is the honest summary in that situation.
A quick test: compare the mean and the median. If they are far apart, the data is skewed and the mean alone will mislead.
What is the difference between the mean, the median and the mode?
The mean is the sum over the count. The median is the middle value once sorted. The mode is the most frequent value. On symmetric data all three land close together; on skewed data they separate, and the gap between them is itself informative. The mean, median and mode calculator reports all three at once.
Does the average tell me everything about my data?
No, and this is the single most useful thing to know about averages. The sets
50, 50, 50 and 0, 50, 100 have the same mean of 50 and could not
be more different. The average locates the data; it says nothing about how spread out it is.
That is what the standard deviation measures, and why the two are almost
always reported together.
What is a weighted average?
One where some values count for more than others: course credits, portfolio holdings, or class sizes. Multiply each value by its weight, add those products, then divide by the sum of the weights rather than by the count. A plain average of the same numbers gives a different, and usually wrong, answer.
How do I find the average of test scores?
Add the scores and divide by how many there are: 72, 85 and 91 average 248 ÷ 3 = 82.67. If the tests carry different weights, use a weighted average instead, or the grade average calculator.
Related calculators
-
Median calculator
The middle value: the average that ignores outliers.
-
Mean, median and mode
All three averages plus the range, side by side.
-
Standard deviation calculator
How far the data sits from its average.
-
Weighted standard deviation
When some observations count for more than others.