Statistics
Mean calculator for individual, discrete and continuous series
The arithmetic mean of raw data, a frequency table or grouped class intervals, worked by the method your textbook asks for. Pick the type of series and the method, enter the data, and the calculator builds the working table and the substitution step by step. To compare it with the geometric and harmonic means of the same data, use the arithmetic mean calculator.
Separate with commas, spaces or new lines.
Leave blank to use the middle value or class midpoint.
Leave blank for the class width, or the largest number dividing every deviation.
The mean is the balance point: the bars on each side of the red line marked x̄ would balance, counting each by its frequency. A is the assumed mean the short-cut starts from.
| Class | Mid-value x | f | d = x − 25 | u = d ÷ 10 | fu |
|---|---|---|---|---|---|
| 0–10 | 5 | 5 | −20 | −2 | −10 |
| 10–20 | 15 | 8 | −10 | −1 | −8 |
| 20–30 | 25 | 15 | 0 | 0 | 0 |
| 30–40 | 35 | 16 | 10 | 1 | 16 |
| 40–50 | 45 | 6 | 20 | 2 | 12 |
| Σ | 50 | 10 |
Show the working, step by step
Find the mid-value of each class: (lower limit + upper limit) ÷ 2.
0–10 → (0 + 10) ÷ 2 = 5 10–20 → (10 + 20) ÷ 2 = 15 20–30 → (20 + 30) ÷ 2 = 25 30–40 → (30 + 40) ÷ 2 = 35 40–50 → (40 + 50) ÷ 2 = 45
Add the frequencies.
N = 50
Take an assumed mean A = 25 (the middle class midpoint) and a common factor h = 10 (the class width). Find each step deviation u = (x − A) ÷ h.
Multiply each u by its frequency and add (the fu column).
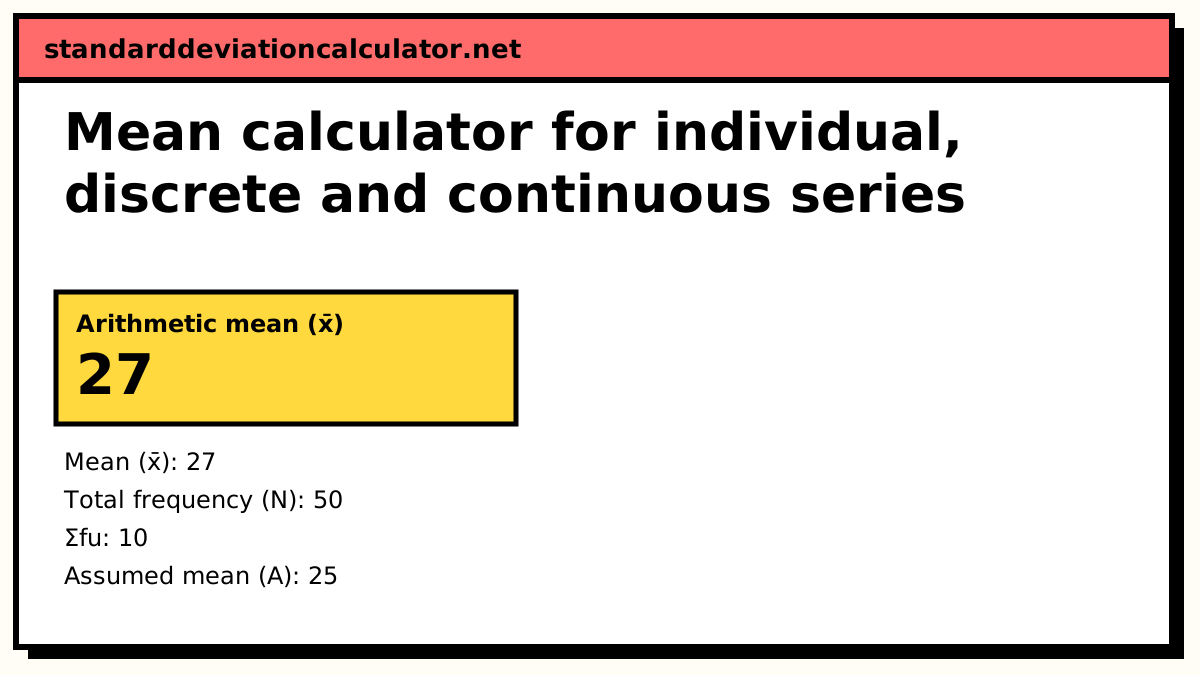
Σfu = 10
Scale back up by h and add A.
x̄ = A + (Σfu ÷ N) × h = 25 + (10 ÷ 50) × 10 = 25 + 2 = 27
Check by the direct method: Σfx ÷ N = 1350 ÷ 50 = 27. For grouped data this assumes the values in each class sit at its midpoint, so it can differ slightly from the mean of the raw data.
If you only need the mean of a plain list of numbers, the average calculator is quicker. This page is for the series and methods taught in statistics courses, such as CBSE Class 11 economics and Class 10 maths.
The three types of series
| Series | What you are given | x used in the formula |
|---|---|---|
| Individual | Each observation separately: 14, 18, 25, … | The observation itself (f = 1) |
| Discrete | Values with frequencies: x = 10 occurs 3 times, … | The value |
| Continuous | Class intervals with frequencies: 0–10 has 5, … | The mid-value of the class |
The formulas
Direct: x̄ = Σfx ÷ N Assumed mean: x̄ = A + Σfd ÷ N, d = x − A Step deviation: x̄ = A + (Σfu ÷ N) × h, u = (x − A) ÷ h
For an individual series every f is 1, so N becomes n and Σfx becomes Σx. A is any convenient value, usually one near the middle of the data. h is a common factor of all the deviations, which for equal classes is the class width.
A worked example (the default data)
Marks of 50 students are grouped as 0–10 (5 students), 10–20 (8), 20–30 (15), 30–40 (16) and 40–50 (6).
| Class | Mid-value x | f | fx | u = (x − 25) ÷ 10 | fu |
|---|---|---|---|---|---|
| 0–10 | 5 | 5 | 25 | −2 | −10 |
| 10–20 | 15 | 8 | 120 | −1 | −8 |
| 20–30 | 25 | 15 | 375 | 0 | 0 |
| 30–40 | 35 | 16 | 560 | 1 | 16 |
| 40–50 | 45 | 6 | 270 | 2 | 12 |
| Total | 50 | 1,350 | 10 |
- Direct: x̄ = 1,350 ÷ 50 = 27.
- Assumed mean with A = 25: the deviations are −20, −10, 0, 10, 20, so Σfd = −100 − 80 + 0 + 160 + 120 = 100 and x̄ = 25 + 100 ÷ 50 = 27.
- Step deviation with A = 25, h = 10: Σfu = 10, so x̄ = 25 + (10 ÷ 50) × 10 = 25 + 2 = 27.
The calculator starts on the step-deviation method. Switch the method to see the other two tables; the answer stays at 27.
Individual and discrete examples
Individual series. For 14, 18, 25, 31, 22, 16, 27, 19: Σx = 172 and n = 8, so x̄ = 21.5. By the short-cut method with A = 20 the deviations add to 12, and 20 + 12 ÷ 8 = 21.5.
Discrete series. For x = 10, 20, 30, 40, 50 with f = 3, 8, 12, 5, 2: N = 30 and Σfx = 850, so x̄ = 850 ÷ 30 = 28.33. With A = 30, Σfd = −50 and x̄ = 30 − 50 ÷ 30 = 28.33.
Common mistakes
- Dividing by the number of rows instead of by N = Σf. A table with 5 classes and 50 students is divided by 50.
- Using the lower class limit instead of the mid-value for a continuous series.
- Forgetting to multiply by h at the end of the step-deviation method. Σfu ÷ N is in units of h, not in the original units.
- Sign slips in d. Values below A give negative deviations; they must be subtracted in Σfd, not added.
- Choosing an h that does not divide every deviation. It still gives the right mean, but the u values stop being whole numbers and the short-cut is lost.
Why use the short-cut methods at all?
By hand, fx products for large values (mid-values like 1,250 and frequencies like 48) are slow and error-prone. Subtracting A and dividing by h shrinks the numbers to small integers such as −2, −1, 0, 1, 2. The same u column is reused later for the standard deviation of grouped data, which is another reason exams favour the step-deviation method.
Common questions
What is the difference between the direct, short-cut and step-deviation methods?
Only the arithmetic. The direct method multiplies each value by its frequency and divides Σfx by N. The assumed-mean (short-cut) method subtracts a convenient value A first, so the products are smaller: x̄ = A + Σfd ÷ N. The step-deviation method also divides the deviations by a common factor h: x̄ = A + (Σfu ÷ N) × h. All three give exactly the same mean. For the default table above each one gives 27.
Does the choice of assumed mean A change the answer?
No. Any A works, including a value that is not in the data. A value near the middle keeps the deviations small, which is why textbooks pick the middle value or the midpoint of the class with the largest frequency. Try typing a different A into the calculator: the working changes, the mean does not.
How do I find the mean of a continuous series?
Replace each class by its mid-value, x = (lower limit + upper limit) ÷ 2, then treat the table as a discrete series: x̄ = Σfx ÷ N. For 0–10, 10–20, 20–30, 30–40, 40–50 with frequencies 5, 8, 15, 16, 6 the mid-values are 5, 15, 25, 35, 45, Σfx = 1,350 and N = 50, so the mean is 27.
Is the mean of grouped data exact?
Not quite. Using mid-values assumes that the observations in each class are centred on the middle of the class. If the raw data were available their mean could differ slightly. The error is usually small when classes are narrow and the frequencies are large.
What if the classes are inclusive, like 10–19 and 20–29?
For the mean you can use the classes as they are: the mid-value of 10–19 is 14.5 either way. Converting to boundaries (9.5–19.5) only matters for the median and the mode, which the median and mode calculator does for you.
Related calculators
-
Average calculator
The plain mean of a list of numbers, with the median and mode.
-
Median and mode
The other two averages for the same three types of series.
-
Missing frequency
Work backwards from a known mean to a missing value or frequency.
-
Weighted mean
Σwx ÷ Σw, for index numbers and weighted averages.
-
Grouped data SD
The spread of the same kind of frequency table.