Root mean square calculator
Enter your numbers to get their root mean square (the square root of the mean of the squares) with the sum of squares, the arithmetic mean and the standard deviation of the same data alongside, so you can see exactly how the three relate.
Separate numbers with commas, spaces or new lines, or paste a spreadsheet column.
Decimals and negatives are fine; write 10:3 for a value that occurs 3 times.
Your results will appear here: the result first, then the rest of the summary and a chart.
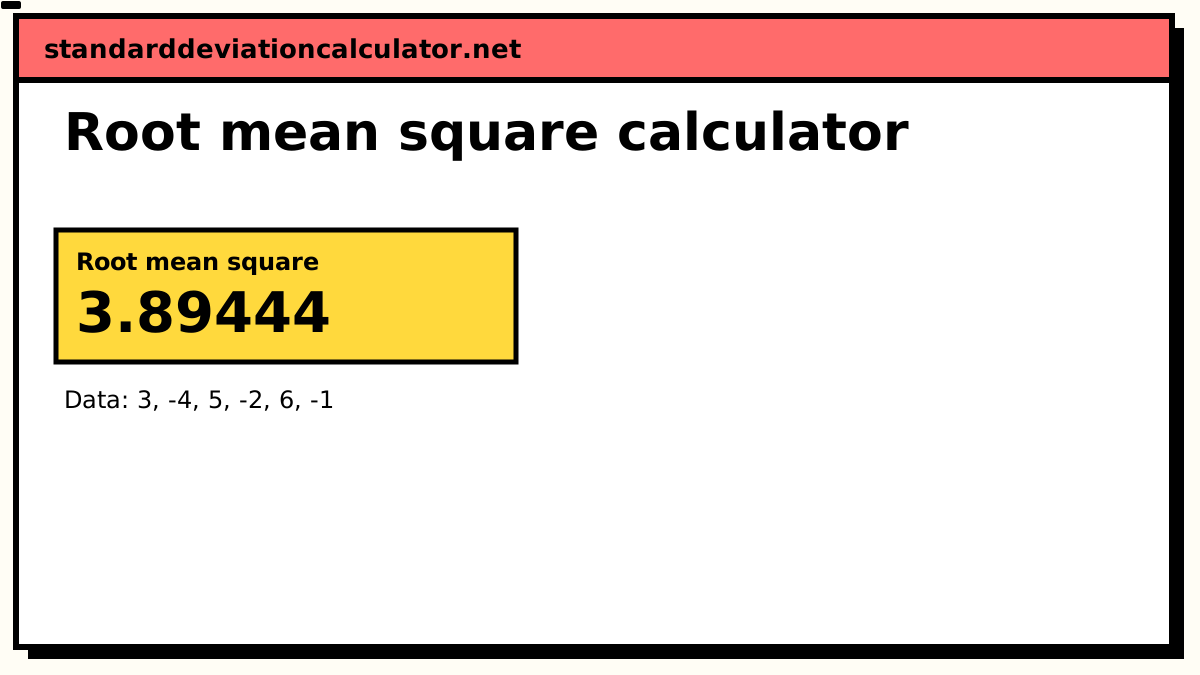
Root mean square
3.89444
Data distribution
Shaded bands mark ±1, ±2 and ±3 SD from the mean. 4 of 6 values (67%) fall within ±1 SD.
Chart as text
Mean 1.16667, sample standard deviation s = 4.07022, from 6 values between -4 and 6.
- Within ±1 SD (-2.904 to 5.237): 4 of 6 values (67%). About 68% for normal data.
- Within ±2 SD: 6 (100%). About 95% for normal data.
- Within ±3 SD: 6 (100%). About 99.7% for normal data.
Show the working, step by step
Root mean square formula
RMS = √(Σx² / n)
Three operations, in the reverse of the order the name lists them: square every value, take the mean of those squares, then take the square root. The result is in the same units as the data, and it is never negative. Some texts call it the quadratic mean, which puts it in a family with the arithmetic, geometric and harmonic means; the name is the same quantity.
Root mean square: a worked example
Data: 3, −4, 5, −2, 6, −1. Six values, three of them negative.
| x | x² |
|---|---|
| 3 | 9 |
| −4 | 16 |
| 5 | 25 |
| −2 | 4 |
| 6 | 36 |
| −1 | 1 |
| Σ | 91 |
The sum of squares is 91. Divide by n = 6 for the mean of squares, 15.1667. Take the square root: RMS = 3.8944.
Compare that with the arithmetic mean. The values sum to 7, so the mean is 7 ÷ 6 = 1.1667, barely a third of the RMS. Nothing in the data is small; the mean is small because the negatives cancelled most of the positives. The RMS reports how big the numbers are, and the mean reports where their centre sits. Those are different questions.
Why square, then root
Squaring makes every term positive, so the sign of a value stops mattering and a −4 contributes exactly as much as a +4. That is the whole point when the quantity in question swings both ways around zero: an alternating current, a vibration, an error that is sometimes too high and sometimes too low. Averaging such a thing directly gives a number near zero, which is true and useless.
The square root at the end undoes the change of units that squaring caused. The mean of the squares of a set of voltages is in volts squared; its root is back in volts, and can be compared with the original readings.
There is a physical reason for choosing squares over absolute values, which would remove signs just as well. Power is proportional to the square of amplitude: the heat produced in a resistor is V²/R, the energy in a wave goes as the square of its height. So the mean of the squares is the average power, up to a constant, and the RMS is the steady value that would deliver that power. The RMS of an AC voltage is the DC voltage that would make the same resistor equally hot. That is why mains supplies are quoted as 230 V or 120 V; those are RMS figures, and the waveform peaks at √2 times them, about 325 V and 170 V respectively.
RMS and the arithmetic mean
The RMS is never smaller than the absolute value of the mean, and equals it only when every value in the list is the same. The identity behind that fact is the most useful thing on this page:
RMS² = x̄² + σ²
where σ is the population standard deviation. The mean of the squares splits cleanly into the square of the mean plus the variance. Since a variance cannot be negative, RMS² ≥ x̄², and the two are equal exactly when σ = 0. In the example, 1.1667² + 3.7156² = 1.3611 + 13.8056 = 15.1667, which is the mean of squares found above. The calculator reports that check on every dataset you enter.
RMS and standard deviation
The population standard deviation is itself a root mean square: the RMS of the deviations from the mean. Write it out and the shape is identical:
σ = √(Σ(x − x̄)² / n)
The only difference is that the standard deviation subtracts the mean first. RMS measures the values about zero; SD measures them about their own centre. For the example, the RMS of the raw values is 3.8944 and the RMS of their deviations (the population SD) is 3.7156, slightly smaller because shifting the origin from 0 to 1.1667 brought the values a little closer on balance.
When the mean is zero there is nothing to subtract, and the RMS and the population SD are the same number. That happens more often than it sounds: any symmetrical waveform, any set of residuals from a least-squares fit, any noise measured about its baseline. Engineers who say "RMS noise" and statisticians who say "standard deviation of the noise" are describing the same quantity. The variance is the mean square of the deviations, so it sits one square root below the SD in exactly the way the mean of squares sits below the RMS; what the standard deviation means covers the interpretation side.
Root sum square (RSS)
The root sum square drops the averaging step: square each value, add them up, and take the square root.
RSS = √(Σx²) = RMS × √n
Its main use is combining independent sources of variation, most often in tolerance stack-up. A worst-case stack adds the tolerances outright. An RSS stack treats them as independent errors that rarely all hit their limits in the same direction, so it combines them the way standard deviations combine: through their squares. Three parts toleranced at ±0.1, ±0.2 and ±0.2 mm give a worst case of ±0.5 mm but an RSS of √(0.1² + 0.2² + 0.2²) = ±0.3 mm. The same rule gives the combined uncertainty of a measurement from independent components, and the length of a vector from its components.
RSS is only valid when the contributions really are independent and roughly normal. Parts from one batch or one machine setting tend to drift together, and then the worst case is closer to the truth than the RSS figure.
Root mean square error
In regression, the RMS of the residuals (observed minus predicted) is the root mean square error, RMSE. It is the standard summary of how far a model's predictions typically miss, in the units of the thing being predicted. A model that is off by +1.5, −2, +0.5, −1 and +1 has a mean error of exactly zero and an RMSE of 1.3038; the zero says the model is not biased, and the 1.3038 says how much it wobbles. The MSE calculator takes actual and predicted values and returns MSE, RMSE, MAE and MAPE together.
Because it squares before averaging, RMSE penalises a few large misses more heavily than many small ones. That is usually wanted (one prediction that is wildly wrong matters more than several slightly wrong), but it does mean RMSE is sensitive to outliers in a way the mean absolute error is not. The linear regression calculator reports the residuals so you can compute either.
The sine-wave factor
For a pure sine wave the ratio of RMS to peak is fixed: 1/√2 ≈ 0.7071. A signal
that peaks at 10 V has an RMS of 7.071 V; a supply with an RMS of 230 V peaks
at 230 × √2 ≈ 325 V. The factor comes from the mean of sin² over a full cycle being
exactly one half. It is specific to sine waves: a square wave has an RMS equal to its peak,
a triangle wave has peak/√3, and an arbitrary signal has to be squared and averaged
directly, which is what this calculator does with any list of samples you paste in.
Common mistakes
- Averaging first, then squaring. The square of the mean is not the mean of the squares: for the example, 1.1667² = 1.3611 against 15.1667. The order in the name is the order to undo, not to do: square, then mean, then root.
- Mixing units. Every value must be in the same unit before squaring, or the squares are incomparable. Convert millivolts to volts, or metres to millimetres, before you start.
- Applying n − 1. The RMS describes the numbers in front of you and divides by n. The n − 1 correction belongs to the sample standard deviation, which estimates a population; it has no place in an RMS.
- Using the sine-wave factor on a signal that is not a sine wave. Multiplying the peak by 0.7071 is only right for one waveform. For anything else, sample it and compute the RMS properly.
Related calculators
-
Standard deviation
The RMS of the deviations from the mean.
-
Variance calculator
The mean square of the deviations: the σ² in RMS² = mean² + σ².
-
Sum of squares
Σx² and Σ(x − x̄)², the two sums this page rests on.
-
Average calculator
The arithmetic mean, which the RMS can never fall below.
Common questions
What is the root mean square?
The square root of the average of the squared values:
RMS = √(Σx² / n). Square every number, take the mean of the squares, then
take the square root of that mean. It is also called the quadratic mean, and it is the
natural "typical size" of a quantity whose sign does not matter.
What is the difference between RMS and standard deviation?
The RMS measures values about zero; the standard deviation measures
them about their mean. The population SD is exactly the RMS of the
deviations x − x̄, so the two share a formula and differ only in what is
subtracted first.
They are tied together by RMS² = mean² + σ². When the mean is zero (an
AC waveform, a set of regression residuals, noise about a baseline), the RMS and the
population SD are the same number.
Is the RMS the same as the average?
No. The RMS is always at least as large as the absolute value of the arithmetic mean,
and equals it only when every value is identical. The gap between them is the spread:
RMS² − mean² = σ². For the example data above, the mean is 1.1667 but the RMS
is 3.8944, because the negatives that cancelled in the mean count fully in the RMS.
Why is RMS used for AC voltage?
Because power depends on the square of voltage (P = V²/R), and the mean
of a sine wave is zero, so averaging the voltage directly says nothing about how much work
it does. The RMS voltage is the DC voltage that would deliver the same heating power into
the same resistor. For a pure sine wave, VRMS = Vpeak / √2 ≈
0.7071 × Vpeak, so a 230 V mains supply actually peaks at about
325 V.
What is root mean square error (RMSE)?
The RMS of a model's residuals: the differences between predicted and observed values. Squaring keeps over- and under-predictions from cancelling, and the final square root returns the answer to the units of the thing being predicted. Because it squares, RMSE is pulled up more by a few large misses than the mean absolute error is.
Does this calculator use n or n − 1?
The RMS itself always divides by n: it describes the numbers you have,
not a population they were drawn from, so there is no Bessel correction. The grid also
shows the sample standard deviation (which divides by n − 1) for comparison,
but the RMS, the mean of squares and the population SD all use n.