Mean squared error (MSE) calculator
Measure how far predictions are from the actual values. Enter the pairs to get the mean squared error with RMSE, MAE and MAPE alongside, or find the MSE of an estimator from its bias and variance.
| y | ŷ | e = y − ŷ | e² | |e| | |e/y| |
|---|---|---|---|---|---|
| 10 | 11 | −1 | 1 | 1 | 0.1 |
| 12 | 11 | 1 | 1 | 1 | 0.08333 |
| 15 | 13 | 2 | 4 | 2 | 0.1333 |
| 11 | 12 | −1 | 1 | 1 | 0.09091 |
| 14 | 15 | −1 | 1 | 1 | 0.07143 |
| Sum | 0 | 8 | 6 | 0.479 |
┄ perfect prediction (ŷ = y)
Show the working, step by step
Find each error e = y − ŷ and square it.
Σe² = (−1)² + 1² + 2² + (−1)² + (−1)² = 8
Divide by the number of pairs.
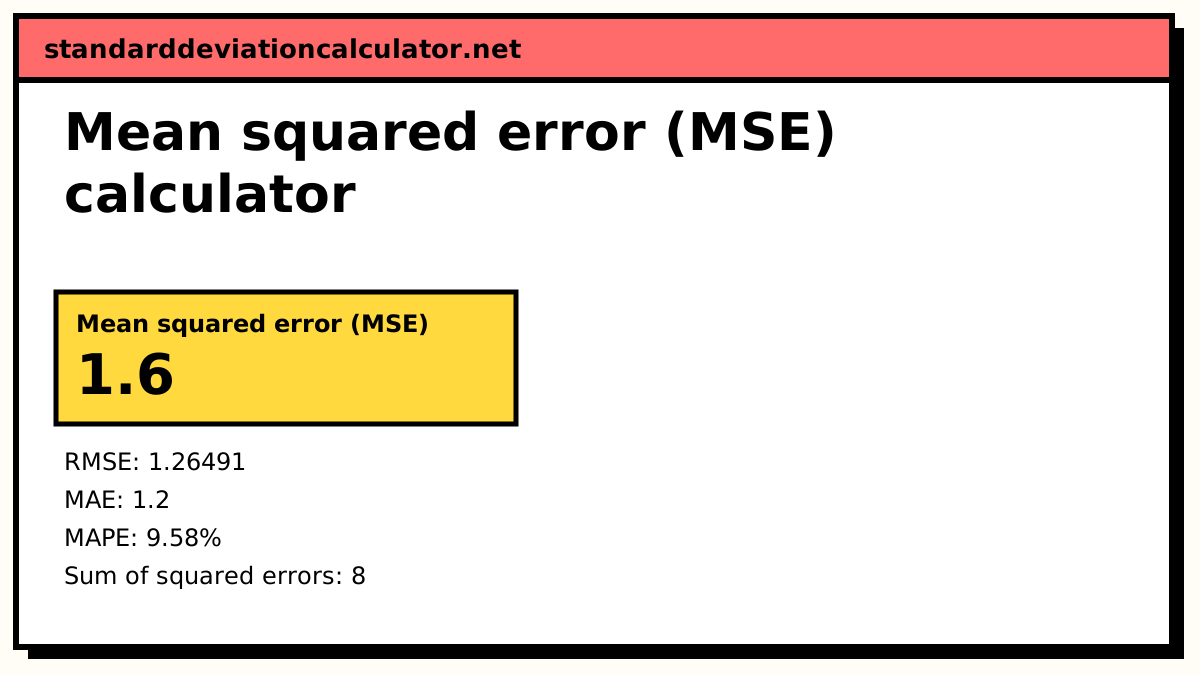
MSE = 8 ÷ 5 = 1.6
The square root puts it back in the units of y.
RMSE = √1.6 = 1.26491
The mean of the absolute errors:
MAE = 6 ÷ 5 = 1.2
The mean of |e/y| as a percentage:
MAPE = 0.479004 ÷ 5 × 100 = 9.58009%
This is the average over the n points. A regression’s residual mean square divides SSE by n − p instead (p = number of fitted parameters), so it will be a little larger.
The formulas
MSE = Σ(y − ŷ)² ÷ n RMSE = √MSE MAE = Σ|y − ŷ| ÷ n MAPE = Σ|(y − ŷ) ÷ y| ÷ n × 100%
y is the actual value, ŷ the prediction and n the number of pairs. For an estimator θ̂ of a parameter θ,
MSE(θ̂) = E[(θ̂ − θ)²] = Var(θ̂) + Bias(θ̂)²
A worked example
The default compares five days of actual sales, 10, 12, 15, 11 and 14, with a forecast of 11, 11, 13, 12 and 15. The errors y − ŷ are −1, 1, 2, −1 and −1.
- Squared errors: 1, 1, 4, 1, 1. They sum to 8, so MSE = 8 ÷ 5 = 1.6.
- RMSE = √1.6 = 1.265 units.
- Absolute errors sum to 6, so MAE = 6 ÷ 5 = 1.2 units.
- The percentage errors are 10%, 8.3%, 13.3%, 9.1% and 7.1%, giving MAPE = 9.58%.
The mean error is 0: the forecast is too high as often as too low, so it is unbiased here, and all of the MSE comes from scatter. RMSE (1.265) is a little above MAE (1.2) because the one error of 2 counts four times as much once squared. The bigger the gap between RMSE and MAE, the more the error is concentrated in a few large misses.
The MSE of an estimator
The estimator options apply the same idea to a statistic. Six simulated estimates of a parameter whose true value is 5 (4.8, 5.3, 5.1, 4.6, 5.4, 5.2) have squared errors summing to 0.5, so MSE = 0.0833. Their mean is 5.067, a bias of 0.067, and their variance is 0.0789: 0.0789 + 0.067² = 0.0833, the same figure. The third option does the sum directly; a variance of 0.04 with a bias of 0.3 gives MSE = 0.04 + 0.09 = 0.13, and most of that comes from the bias.
Interpreting MSE
MSE is only meaningful relative to the scale of y. An RMSE of 1.265 on sales of around 12 is roughly 10% of a typical value; the same RMSE on sales of 1,000 would be excellent. A useful baseline is the variance of y: a model whose MSE is not clearly below that does no better than predicting the average every day.
Common mistakes
- Forgetting to square before averaging, which gives the mean error (often near 0), not the MSE.
- Comparing MSE across data sets on different scales. Use RMSE relative to the mean, or MAPE.
- Using MAPE when some actual values are 0. It is undefined; the calculator warns you.
- Mixing up this MSE (divide by n) with a regression's residual mean square, which divides by n − 2 for a straight line.
Common questions
What is mean squared error?
The average of the squared differences between actual and predicted values. Squaring makes every error positive and weights large errors more heavily than small ones, so one big miss raises the MSE far more than several small ones.
What is the difference between MSE and RMSE?
RMSE is the square root of MSE. MSE is in squared units (dollars squared, degrees squared), which are hard to picture; RMSE is back in the units of the data and can be read as a typical size of error.
Should I use MSE, MAE or MAPE?
Use MSE or RMSE when large errors are especially costly, and when fitting by least squares. Use MAE when all errors count in proportion to their size and you want a figure that is less sensitive to outliers. MAPE is easy to explain as a percentage, but it breaks down when actual values are zero or near zero and penalises over-forecasts and under-forecasts unevenly.
What is a good MSE?
There is no universal threshold, because MSE depends on the scale of the data. Compare it with a baseline, such as the MSE of always predicting the mean (which is the variance of y), or compare models on the same data. Lower is better.
Why is MSE of an estimator variance plus bias squared?
Write θ̂ − θ as (θ̂ − E[θ̂]) + (E[θ̂] − θ). Squaring and averaging, the cross term has mean zero, which leaves E[(θ̂ − E[θ̂])²], the variance, plus (E[θ̂] − θ)², the squared bias.
Related calculators
-
Residual calculator
Residuals, a residual plot and SSE for a fitted line.
-
Root mean square calculator
The quadratic mean of any list of numbers.
-
Linear regression calculator
Fit a least-squares line and see how well it fits.