Statistics
Kendall's tau calculator
Enter paired data to get Kendall's rank correlation. The calculator compares every pair of observations, counts how many are concordant, discordant and tied, and reports tau-a, tau-b and a p-value for the test of no association.
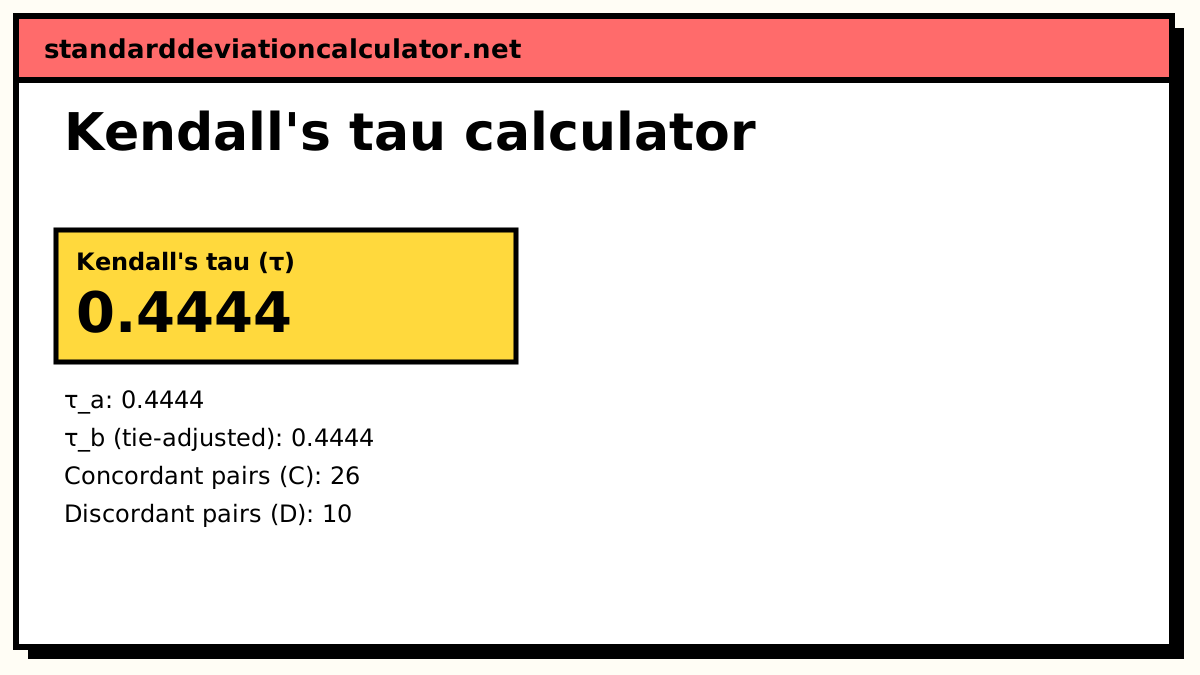
Concordant pairs: 26 (72.2%) Discordant pairs: 10 (27.8%) Tied pairs: 0 (0%)
τ_a is the concordant share minus the discordant share: (26 − 10) ÷ 36.
| x | y | Concordant with later rows | Discordant with later rows |
|---|---|---|---|
| 41.9 | 2.5 | 8 | 0 |
| 44.1 | 4 | 2 | 5 |
| 44.4 | 2.6 | 6 | 0 |
| 44.7 | 3.6 | 3 | 2 |
| 45.2 | 2.8 | 4 | 0 |
| 45.9 | 3.1 | 3 | 0 |
| 50.7 | 5.2 | 0 | 2 |
| 53.3 | 5 | 0 | 1 |
| 60.1 | 3.8 | 0 | 0 |
| Σ | 26 | 10 |
Show the working, step by step
Compare every pair of observations: there are n(n − 1)/2 = 9(8)/2 = 36 pairs. A pair is concordant when x and y move in the same direction, discordant when they move in opposite directions, and tied when either value is equal.
C = 26, D = 10, tied = 0
τ_a divides S = C − D by the total number of pairs.
τ_a = (C − D) ÷ n₀ = (26 − 10) ÷ 36 = 0.444444
τ_b corrects the denominator for ties. n₁ = Σt(t − 1)/2 over groups of tied x values, n₂ likewise for y.
n₁ = 0, n₂ = 0 τ_b = (C − D) ÷ √((n₀ − n₁)(n₀ − n₂)) = 16 ÷ √(36 × 36) = 0.444444
Test H₀: τ = 0 with the normal approximation to S (tie-corrected variance).
Var(S) = n(n − 1)(2n + 5) ÷ 18 = 9 × 8 × 23 ÷ 18 = 92 z = S ÷ √Var(S) = 16 ÷ 9.59166 = 1.6681 p = 0.09529 (two-tailed)
With no ties τ_a and τ_b are equal. This is a moderate positive association (tau runs smaller than r or rho, so ±0.3 is already moderate). For n below about 10 the normal approximation is rough; exact tables are more accurate.
The formulas
τ_a = (C − D) ÷ n₀, n₀ = n(n − 1)/2
τ_b = (C − D) ÷ √((n₀ − n₁)(n₀ − n₂))
C and D are the numbers of concordant and discordant pairs. n₁ = Σt(t − 1)/2 over each group of t tied x values, and n₂ is the same for y. With no ties n₁ = n₂ = 0 and the two versions are equal.
z = (C − D) ÷ √[n(n − 1)(2n + 5) ÷ 18] (no ties)
A worked example
The default data are nine paired measurements (the example used in R's documentation for
cor.test). There are 9 × 8 ÷ 2 = 36 pairs.
- Sort the rows by x. For each row, look at every row below it: if its y is also larger, the pair is concordant; if smaller, discordant.
- The counts add up to C = 26 concordant and D = 10 discordant pairs, with no ties.
- τ = (26 − 10) ÷ 36 = 16 ÷ 36 = 0.4444. With no ties, tau-a and tau-b are the same.
- Var(S) = 9 × 8 × 23 ÷ 18 = 92, so z = 16 ÷ √92 = 16 ÷ 9.592 = 1.668.
- The two-tailed p-value is 0.0953, so at the 5% level there is not enough evidence of association with only nine pairs.
An example with ties
Take x = 12, 2, 1, 12, 2 and y = 1, 4, 7, 1, 0. Of the 10 pairs, 2 are concordant, 6 are
discordant, 1 is tied on x only (the two 2s) and 1 is tied on both (the two rows of 12 and 1).
Tau-a = (2 − 6) ÷ 10 = −0.4. For tau-b, x has two tied pairs (n₁ = 2) and y has one
(n₂ = 1), so τ_b = −4 ÷ √(8 × 9) = −4 ÷ 8.485 = −0.4714. That matches the value SciPy's
kendalltau gives for the same data, with p = 0.2827.
Reading the counts
| Pair type | Condition for two rows i, j | Counts in |
|---|---|---|
| Concordant | (xᵢ − xⱼ) and (yᵢ − yⱼ) have the same sign | C |
| Discordant | Opposite signs | D |
| Tied on x | xᵢ = xⱼ | Neither; reduces τ_b's denominator |
| Tied on y | yᵢ = yⱼ | Neither; reduces τ_b's denominator |
Common mistakes
- Counting tied pairs as concordant. A pair tied on either variable is neither concordant nor discordant.
- Reporting tau-a with tied data. Tau-a cannot reach ±1 when there are ties; tau-b is the usual choice.
- Comparing tau with Pearson's r on the same scale. Tau is typically smaller than r or rho for the same data, so a tau of 0.45 is not weaker than an r of 0.6.
Common questions
What is Kendall's tau?
A rank correlation coefficient based on pairs of observations. For every pair, ask whether the two variables move in the same direction (concordant) or opposite directions (discordant). Tau is the excess of concordant over discordant pairs as a share of all pairs, so it runs from −1 to +1 and has a direct reading: τ = 0.44 means a randomly chosen pair is 44 percentage points more likely to be concordant than discordant.
What is the difference between tau-a and tau-b?
They differ only when there are ties. Tau-a divides C − D by all n(n − 1)/2 pairs, so tied pairs pull it towards zero. Tau-b divides by √((n₀ − n₁)(n₀ − n₂)), which removes the pairs tied on each variable, so it can still reach ±1 with tied data. Tau-b is what R, SciPy, SPSS and Stata report by default.
Should I use Kendall's tau or Spearman's rho?
Both measure monotonic association from ranks and usually lead to the same conclusion. Tau is smaller in size (for the same data |τ| is typically about two-thirds of |ρ|), has a cleaner probability interpretation, and its sampling distribution approaches normal faster, which makes it the better choice for small samples and data with many ties. Spearman's rho is more familiar and easier to compute by hand.
How is the p-value calculated?
From the normal approximation to S = C − D. Under no association S has mean 0 and variance n(n − 1)(2n + 5)/18, reduced by terms for tied values when there are ties. Then z = S ÷ √Var(S). The approximation is adequate from about n = 10; for smaller samples an exact table or exact permutation test is better. Some software also applies a continuity correction (reducing |S| by 1), which gives a slightly larger p-value.
What counts as a strong tau?
Because tau runs smaller than Pearson's r or Spearman's rho, the same verbal labels do not carry over directly. As a rough guide, |τ| around 0.1 is weak, around 0.3 is moderate and 0.5 or more is strong. Always read it alongside the p-value and the sample size.
Related calculators
-
Spearman's rank correlation
Rank correlation from squared rank differences, with the tie correction.
-
Pearson correlation coefficient
Linear correlation of the values themselves.
-
Correlation coefficient calculator
Pearson's r and Spearman's rho together, with a scatter plot.
-
P-value calculator
Turn a z, t, chi-square or F statistic into a p-value.