Correlation and regression calculators
Calculators for paired data: how strongly two variables move together, and the line or curve that predicts one from the other. Use them for lab results, survey scores, sales against spend, or any homework question that hands you an x column and a y column.
Which calculator do I need?
| You have or want | Use |
|---|---|
| Two numeric columns and you want one number for how linear the relationship is | Pearson correlation coefficient |
| Ranked data, ordinal scales, or a relationship that rises steadily but not in a straight line | Spearman's rank correlation |
| A small sample with many tied ranks, or you want the share of pairs that agree in order | Kendall's tau |
| An equation to predict y from x, with slope, intercept and their significance | Linear regression |
| Two to four predictors for one outcome | Multiple regression |
| A yes/no outcome and you want the probability of “yes” at each x | Logistic regression |
| Points that curve, bend or grow by a percentage each step | Polynomial regression |
| A picture of the data first, to see which kind of fit makes sense | Scatter plot maker |
Measure the relationship
One number for how closely two variables move together, from raw pairs or ranks.
-
Scatter plot maker
Plot pasted x, y pairs with axis labels and a trend line, and get the equation, r, R² and flagged outliers.
-
Correlation coefficient
Pearson's r and r² from paired data, with the significance test, Spearman's rho and a confidence interval.
-
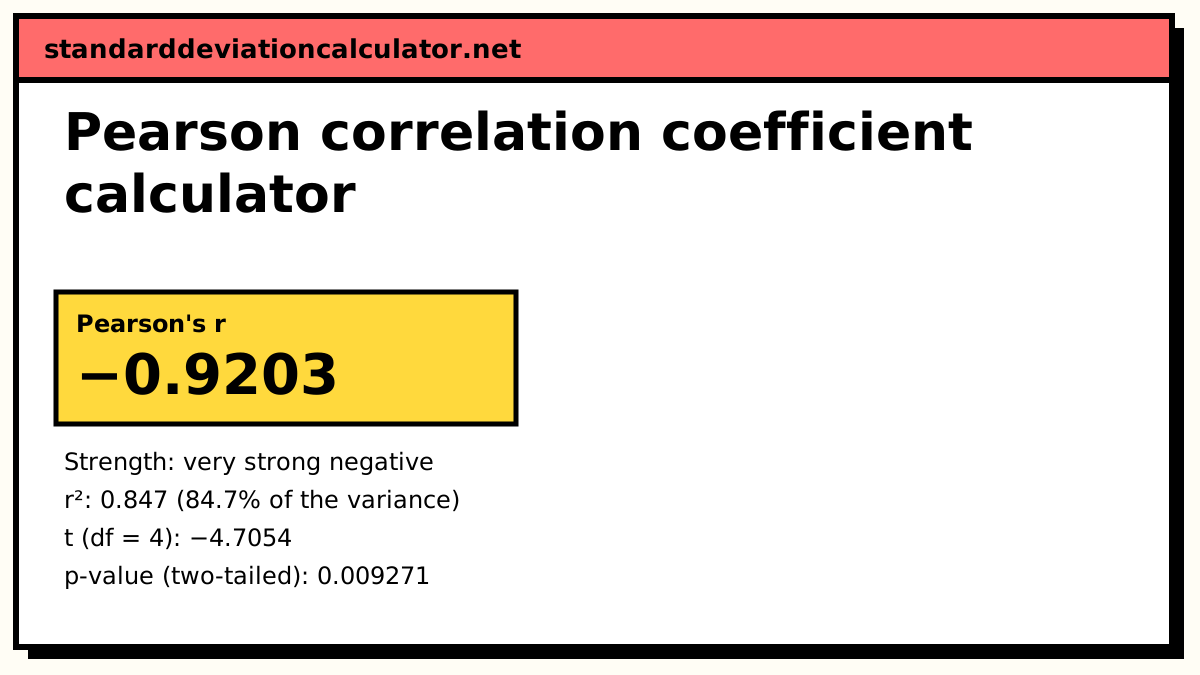
Pearson correlation coefficient calculator
Karl Pearson's r by the actual-mean, direct and assumed-mean methods, with the t-test and a scatter plot.
-
Spearman's rank correlation calculator
Rank correlation from raw data or ranks, with the (m³ − m)/12 correction for tied ranks.
-
Kendall's tau calculator
Tau-a and tau-b from concordant and discordant pairs, with a z test.
-
Covariance calculator
Sample and population covariance of paired data with the deviations table and r.
-
Correlation coefficient calculator (Matthews)
MCC from TP, TN, FP and FN, or from a multiclass confusion matrix.
Fit a line
Least-squares models that predict an outcome from one or more predictors.
-
Linear regression calculator
Least-squares line with slope, intercept, R², standard errors, the significance test and a fitted-line plot.
-
Multiple regression calculator
Least-squares fit with up to four predictors: coefficients, t-tests, R² and the F-test.
-
Logistic regression calculator
Binary logistic regression by maximum likelihood, with odds ratios and predicted probabilities.
Fit a curve
When the scatter plot bends, fit a polynomial or exponential model instead of a straight line.
-
Quadratic regression calculator
Least-squares y = ax² + bx + c with R², a fitted-curve chart and predictions.
-
Cubic regression calculator
Fit y = ax³ + bx² + cx + d, with R², adjusted R² and a chart of the curve.
-
Polynomial regression calculator
Polynomial fit of degree 1 to 6, with a table comparing adjusted R² across degrees.
-
Exponential regression calculator
Fit y = a·e^(bx) and y = a·b^x by log-linear least squares, with growth rate and predictions.
Check the fit
How much of the variation the model explains and how far its predictions miss.
-
Coefficient of determination calculator
R² and adjusted R² from x, y data, from actual vs predicted values, or from sums of squares.
-
Residual calculator
Residuals, a residual plot and SSE for a least-squares or given line.
-
MSE calculator
MSE, RMSE, MAE and MAPE from actual and predicted values.
Correlation or regression?
Correlation answers “how closely do these two move together?” with a single unitless number between −1 and 1. It treats x and y the same way: swap the columns and r does not change. Regression answers “what y should I expect at this x?” and gives an equation in the units of your data. Swap the columns and you get a different line. If you only need to report the strength of a relationship, use a correlation coefficient; if you need predictions, use linear regression. For a straight-line fit the two meet at R² = r².
Which correlation coefficient?
Pearson's r measures straight-line association and is pulled around by extreme values. Spearman's rho is Pearson's r computed on ranks, so it measures any relationship that only ever goes up (or only ever goes down). Kendall's tau counts concordant and discordant pairs; its values run smaller than Spearman's on the same data, and it copes better with small samples and ties. Here is what one outlier does to each, for x = 1, 2, 3, 4, 5:
| y values | Pearson r | Spearman rho | Kendall tau |
|---|---|---|---|
| 1, 2, 3, 4, 5 | 1.000 | 1.000 | 1.000 |
| 1, 2, 3, 4, 50 | 0.743 | 1.000 | 1.000 |
The order of the points has not changed, so both rank measures stay at 1. Pearson drops to 0.743 because the last point sits far above the straight line through the others; the least-squares line becomes y = 10x − 18 with R² = 0.552. A scatter plot shows this at a glance, which is why it is worth drawing one before you pick a method.
Common mix-ups
- Covariance is not correlation. Covariance keeps the units of x times y, so its size depends on the scale. Divide by both standard deviations to get r.
- A high R² does not mean the model is right. A straight line through curved data can still score well. Look at the residuals: a pattern in them means a curve fits better.
- Adding polynomial terms always raises R². Compare adjusted R² instead, which the polynomial regression calculator tabulates for each degree.
- The Matthews coefficient is for classifiers. MCC is a correlation between predicted and actual yes/no labels from a confusion matrix, not between two measured variables.
Guides to read alongside
Common questions
What counts as a strong correlation?
A common rule of thumb reads |r| below 0.3 as weak, 0.3 to 0.7 as moderate and above 0.7 as strong, but the right threshold depends on the field. In physics r = 0.9 can be poor; in psychology r = 0.3 is often worth reporting. Always check the p-value or confidence interval as well, since a large r from five points can still be chance.
Does correlation prove that x causes y?
No. A correlation says two variables move together, not why. A third variable can drive both, or the causation can run the other way. Only a controlled experiment, or a careful design that rules out the alternatives, supports a causal claim.
When should I use logistic rather than linear regression?
Use logistic regression when the outcome is binary: passed or failed, bought or did not buy. A straight line fitted to 0/1 data predicts values below 0 and above 1, while the logistic curve keeps every prediction between 0 and 1 and gives odds ratios for each predictor.