Statistics
Spearman's rank correlation calculator
Enter paired values, or ranks you have already assigned, to get Spearman's rank correlation coefficient. The calculator ranks each column, handles tied values with average ranks and the textbook correction factor, and shows the rank table used in the working.
┄ Perfect agreement, ρ = 1 (R₂ = R₁) ━ Your 10 pairs, ρ = 0.733
| X | Y | R₁ (rank X) | R₂ (rank Y) | d = R₁ − R₂ | d² |
|---|---|---|---|---|---|
| 48 | 13 | 8 | 5.5 | 2.5 | 6.25 |
| 33 | 13 | 6 | 5.5 | 0.5 | 0.25 |
| 40 | 24 | 7 | 10 | −3 | 9 |
| 9 | 6 | 1 | 2.5 | −1.5 | 2.25 |
| 16 | 15 | 3 | 7 | −4 | 16 |
| 16 | 4 | 3 | 1 | 2 | 4 |
| 65 | 20 | 10 | 9 | 1 | 1 |
| 24 | 9 | 5 | 4 | 1 | 1 |
| 16 | 6 | 3 | 2.5 | 0.5 | 0.25 |
| 57 | 19 | 9 | 8 | 1 | 1 |
| Σ | 0 | 41 |
Show the working, step by step
Rank each column separately, 1 for the smallest. Tied values share the average of the ranks they would occupy (three values tied for 3rd, 4th and 5th each get 4).
Square the differences and add them.
Σd² = 6.25 + 0.25 + 9 + 2.25 + 16 + 4 + 1 + 1 + 0.25 + 1 = 41
For each group of m tied ranks add (m³ − m)/12 to Σd².
X: m = 3 → (3³ − 3) ÷ 12 = 2 Y: m = 2 → (2³ − 2) ÷ 12 = 0.5 Y: m = 2 → (2³ − 2) ÷ 12 = 0.5 CF = 3
Apply the formula.
ρ = 1 − 6(Σd² + CF) ÷ (n(n² − 1)) ρ = 1 − 6 × (41 + 3) ÷ (10 × (10² − 1)) = 1 − 264 ÷ 990 = 0.733333
Test H₀: no monotonic association, using the t approximation (reasonable for n ≥ 10).
t = ρ√((n − 2) ÷ (1 − ρ²)) = 3.0509, p = 0.0158
With ties, the textbook formula (with the correction) and Pearson's r computed on the average ranks are not identical: 0.733333 against 0.746928. Most syllabi expect the formula value; statistics software reports the Pearson-on-ranks value.
The formula
ρ = 1 − 6Σd² ÷ (n(n² − 1))
d is the difference between the two ranks of each pair and n is the number of pairs. When some values are repeated, add a correction for every group of m tied values, in either variable:
ρ = 1 − 6[Σd² + Σ(m³ − m)/12] ÷ (n(n² − 1))
A worked example with repeated ranks
The default data are marks of ten students in two subjects: X = 48, 33, 40, 9, 16, 16, 65, 24, 16, 57 and Y = 13, 13, 24, 6, 15, 4, 20, 9, 6, 19.
- Rank X from the smallest: 9 is 1st; the three 16s share ranks 2, 3 and 4, so each gets 3; then 24 is 5, 33 is 6, 40 is 7, 48 is 8, 57 is 9 and 65 is 10.
- Rank Y: 4 is 1st; the two 6s share 2 and 3, so each gets 2.5; 9 is 4; the two 13s share 5 and 6, so each gets 5.5; then 15 is 7, 19 is 8, 20 is 9 and 24 is 10.
- Subtract the ranks pair by pair and square: the squared differences add up to Σd² = 41.
- Correction factor: X has one group of three ties, (27 − 3) ÷ 12 = 2; Y has two pairs, 0.5 each. Total 3.
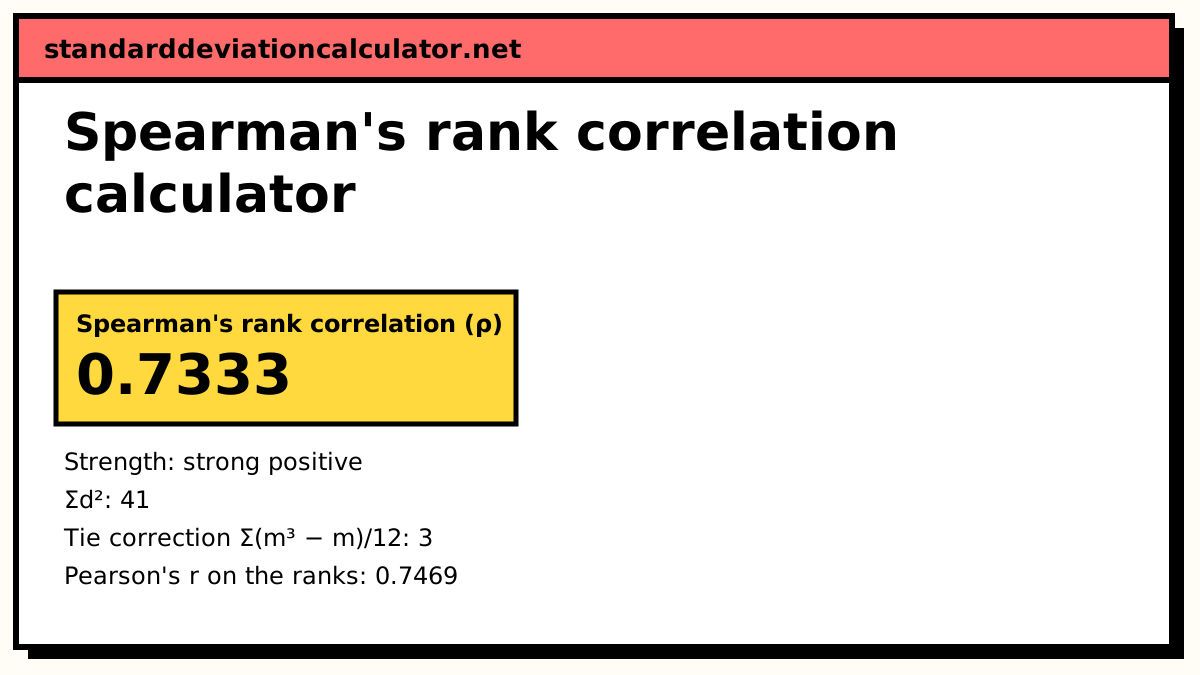
- ρ = 1 − 6 × (41 + 3) ÷ (10 × 99) = 1 − 264 ÷ 990 = 0.7333.
That is a strong positive rank correlation: students who did well in one subject mostly did well in the other. The t approximation gives t = 3.051 on 8 degrees of freedom and p = 0.0158, so the association is significant at the 5% level.
Formula versus Pearson on the ranks
Spearman's rho is defined as Pearson's correlation coefficient computed on the ranks. When there are no ties the short formula above is an exact rearrangement of that, so both give the same value. When there are ties, the short formula (even with the correction factor) is an approximation. For the default data Pearson on the average ranks gives 0.7469, against 0.7333 from the formula.
| Situation | Formula | Pearson on ranks |
|---|---|---|
| No ties | Exact | Same value |
| Ties, with correction | What most textbooks and exam boards expect | What Excel, R, SPSS and SciPy report |
| Ties, no correction | Biased; avoid | n/a |
Entering ranks directly
Choose “Ranks already assigned” when your data are rankings, such as two judges placing ten entries. The ranks for n items must add up to n(n + 1)/2 (55 for ten items); the calculator checks this, because a missing or doubled rank is the most common slip. A tie in the ranks is entered as the shared average, for example 3.5 and 3.5.
Common mistakes
- Giving tied values the same low rank. Two values tied for 2nd both get 2.5, not 2, and the next value is 4th.
- Ranking in opposite directions. Rank both variables the same way (smallest = 1 for both, or largest = 1 for both). Mixing them flips the sign of ρ.
- Forgetting the −1 in n² − 1. For n = 10 the denominator is 10 × 99 = 990, not 1,000.
- Leaving out ties in the second variable. The correction applies to repeated values in X and in Y.
Common questions
What is Spearman's rank correlation coefficient?
A measure of how consistently two variables rise or fall together, computed from their ranks rather than their values. It is written ρ (rho) or rs and runs from −1 (the ranks are exactly reversed) to +1 (the ranks agree exactly). Because it uses only order, it suits ordinal data such as judges' rankings, and it is not thrown off by outliers or by a curved but steadily rising relationship.
How do I rank tied (repeated) values?
Give each tied value the average of the ranks they would have taken. If two values tie for 5th and 6th place, both get 5.5; if three tie for 2nd, 3rd and 4th, all three get 3. The next value carries on from the next unused rank. In the default data, the three 16s in X occupy ranks 2, 3 and 4, so each gets 3.
What is the correction factor for repeated ranks?
For every group of m tied values, add (m³ − m) ÷ 12 to Σd² before using the formula. A pair of ties adds (8 − 2) ÷ 12 = 0.5 and a group of three adds (27 − 3) ÷ 12 = 2. Do this for ties in both variables. The default example has one group of three in X and two pairs in Y, so the correction is 2 + 0.5 + 0.5 = 3.
Why doesn't my answer match Excel or SPSS?
With ties, software computes Pearson's r on the average ranks, which is the exact definition of Spearman's rho. The textbook formula with the (m³ − m)/12 correction is a close approximation to it, not the same number. For the default data the formula gives 0.7333 and Pearson on the ranks gives 0.7469. With no ties the two agree exactly. The calculator shows both so you can match whichever your course or software uses.
When should I use Spearman instead of Pearson?
Use Spearman when the data are ranks or ordinal scores, when the relationship is monotonic but curved, or when outliers would dominate Pearson's r. Use Pearson when both variables are measured on an interval scale and the scatter plot shows a straight-line pattern.
Related calculators
-
Pearson correlation coefficient
Karl Pearson's r by the actual-mean, direct and assumed-mean methods.
-
Kendall's tau
Another rank correlation, built from concordant and discordant pairs.
-
Correlation coefficient calculator
Pearson's r and Spearman's rho side by side, with a scatter plot.
-
Percentile calculator
Where a value ranks within a data set.