Statistics
Z-test calculator
Choose the test, enter the summary figures and pick the alternative hypothesis. The calculator gives the z statistic, the p-value, the critical value at your significance level and whether to reject the null hypothesis, with each step shown.
━ Standard normal curve under H₀ ━ Critical values (±1.96)
Show the working, step by step
Standard error of the mean.
SE = σ ÷ √n = 15 ÷ √36 = 2.5
Test statistic.
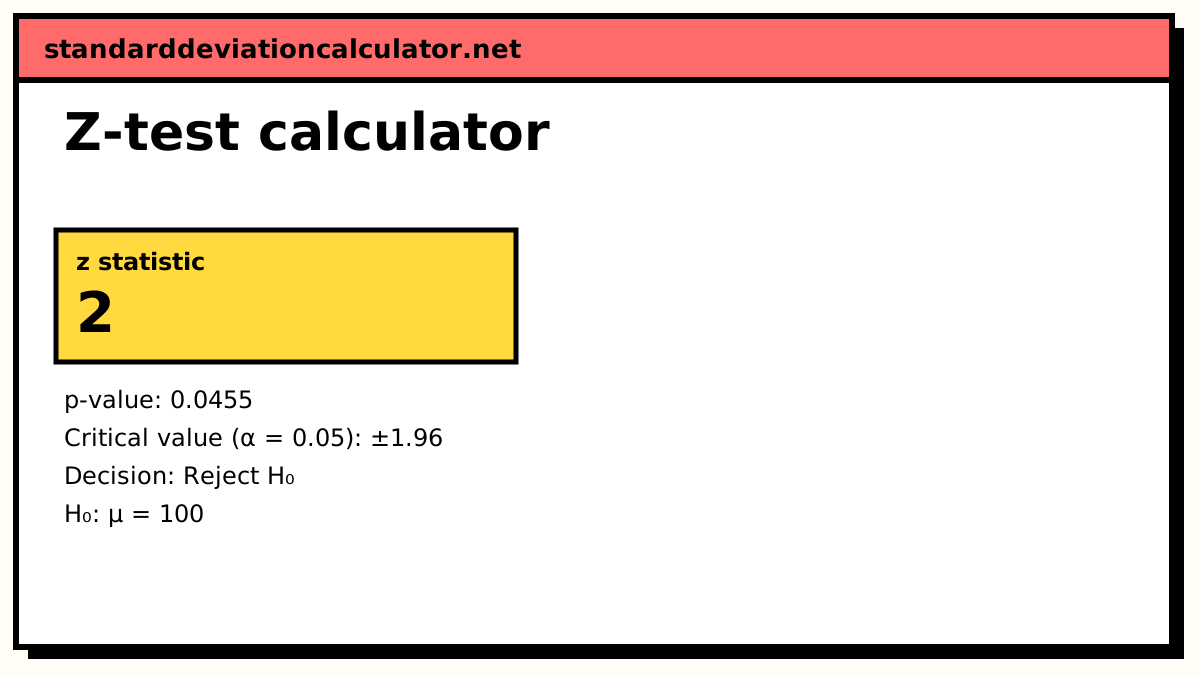
z = (x̄ − μ₀) ÷ SE = (105 − 100) ÷ 2.5 = 2
p-value for H₁: μ ≠ 100.
p = 2 × P(Z > |2|) = 0.0455
Decision at α = 0.05: reject H₀ when |z| > 1.96.
2 is in the rejection region (p = 0.0455 < 0.05): reject H₀.
The result is statistically significant at the 0.05 level. Significance says the difference is unlikely to be chance alone, not that it is large or important.
The four z-tests
| Test | H₀ | Test statistic |
|---|---|---|
| One-sample mean | μ = μ₀ | z = (x̄ − μ₀) ÷ (σ/√n) |
| Two-sample means | μ₁ − μ₂ = d₀ | z = (x̄₁ − x̄₂ − d₀) ÷ √(σ₁²/n₁ + σ₂²/n₂) |
| One proportion | p = p₀ | z = (p̂ − p₀) ÷ √(p₀(1 − p₀)/n) |
| Two proportions | p₁ = p₂ | z = (p̂₁ − p̂₂) ÷ √(p̄(1 − p̄)(1/n₁ + 1/n₂)) |
In every case z measures how many standard errors the sample result lies from what H₀ predicts. Under H₀ it follows the standard normal distribution, which gives the p-value.
A worked example
The default problem: a population has σ = 15 and a claimed mean of 100. A sample of 36 has mean 105. Is the mean different from 100?
- Hypotheses: H₀: μ = 100; H₁: μ ≠ 100 (two-tailed), α = 0.05.
- Standard error: σ ÷ √n = 15 ÷ 6 = 2.5.
- Test statistic: z = (105 − 100) ÷ 2.5 = 2.00.
- p-value: 2 × P(Z > 2) = 2 × 0.02275 = 0.0455.
- Decision: 2.00 is beyond the critical value 1.96 (equivalently 0.0455 < 0.05), so reject H₀. The sample gives evidence that the mean is not 100.
The other defaults: comparing means of 80 (σ = 10, n = 50) and 76 (σ = 12, n = 60) gives z = 4 ÷ 2.098 = 1.907, p = 0.0565, not significant at 5%. A proportion of 58 out of 100 against p₀ = 0.5 gives z = 0.08 ÷ 0.05 = 1.6, p = 0.1096. Comparing 45 of 200 with 30 of 180 gives a pooled p̄ = 75 ÷ 380 = 0.1974 and z = 1.427, p = 0.1537.
Choosing the tail
Decide the direction from the research question before seeing the data. “Has the mean changed?” is two-tailed. “Has the new process reduced the defect rate?” is left-tailed for the defect rate. Picking a one-tailed test after seeing which way the data point halves the p-value and doubles the real chance of a false positive.
Common mistakes
- Using s as if it were σ with a small sample. With an estimated standard deviation and n below about 30, the t-test gives the correct, wider critical values.
- Using p̂ in the one-proportion standard error. The test uses p₀, because the standard error is calculated as if H₀ were true. p̂ belongs in the confidence interval.
- Reading “do not reject” as “accept”. A non-significant result means the data are consistent with H₀, not that H₀ has been shown to be true.
- Entering a percentage as p₀. Enter 0.5, not 50.
Common questions
When should I use a z-test instead of a t-test?
Use a z-test for a mean when the population standard deviation σ is known, which is rare outside textbook problems and quality control with long process histories. If σ is estimated from the sample, use a t-test. For proportions the z-test is the standard large-sample test, because the standard error comes from the hypothesised proportion itself.
What is the difference between one-tailed and two-tailed?
A two-tailed test asks whether the parameter differs from the hypothesised value in either direction; a one-tailed test asks about one direction only, decided before looking at the data. For the same z, the one-tailed p-value is half the two-tailed one: z = 2 gives 0.0455 two-tailed and 0.0228 right-tailed.
What are the critical values of z?
At α = 0.05 the two-tailed critical values are ±1.960 and the one-tailed value is 1.645. At α = 0.01 they are ±2.576 and 2.326; at α = 0.10, ±1.645 and 1.282. Reject H₀ when z falls beyond the critical value, which is equivalent to p < α.
Why does the two-proportion test use a pooled proportion?
Because the null hypothesis says the two population proportions are equal. Under that assumption the best estimate of the common proportion combines both samples: p̄ = (x₁ + x₂) ÷ (n₁ + n₂). A confidence interval for the difference, which does not assume equality, uses the unpooled standard error instead.
How large does the sample need to be?
For a mean, the z-test is exact when the population is normal; otherwise n of about 30 or more lets the central limit theorem take over. For proportions, check that np₀ and n(1 − p₀) are both at least 10 (or at least 5, in older textbooks). The calculator warns when they are not.
Related calculators
-
T-test calculator
One-sample, two-sample and paired t-tests when σ is unknown.
-
Z-score calculator
Standardise a single value against a mean and SD.
-
P-value calculator
Convert any z, t, χ² or F statistic to a p-value.
-
F-test calculator
Test whether two variances are equal.
-
Critical value calculator
z, t, χ² and F critical values for any α.