Statistics
F-test calculator for two variances
Enter two samples, or their standard deviations or variances with the sample sizes, to test whether the population variances are equal. The calculator gives the F ratio, its degrees of freedom, the p-value and the critical values.
The curve is F(5, 4), the distribution of s₁²/s₂² when the variances are equal. The shaded area is the rejection region at α = 0.05; the line marks your F.
| n | Mean | Σ(x − x̄)² | s² | s | |
|---|---|---|---|---|---|
| Sample 1 | 6 | 29 | 108 | 21.6 | 4.64758 |
| Sample 2 | 5 | 24.6 | 21.2 | 5.3 | 2.30217 |
Show the working, step by step
Sample variances, dividing by n − 1.
s₁² = 108 ÷ 5 = 21.6 s₂² = 21.2 ÷ 4 = 5.3
Divide the first variance by the second.
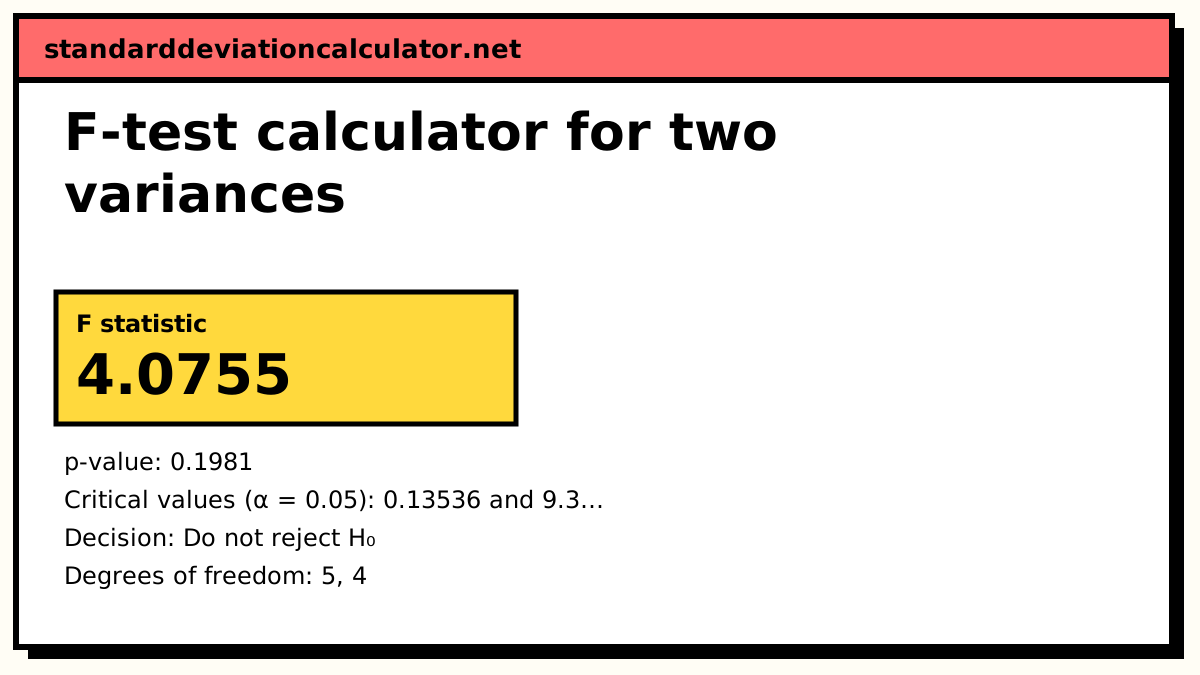
F = s₁² ÷ s₂² = 21.6 ÷ 5.3 = 4.0755 df₁ = n₁ − 1 = 5, df₂ = n₂ − 1 = 4
p-value from the F(5, 4) distribution.
p = 2 × min(P(F ≤ 4.075), P(F ≥ 4.075)) = 0.1981
Critical values at α = 0.05 (α/2 = 0.025 in each tail; the lower one is 1 ÷ F(4, 5)); reject H₀ when F < 0.1354 or F > 9.364.
F = 4.075 is not in the rejection region: do not reject H₀; the data are consistent with equal variances.
The F-test assumes both populations are normal and is sensitive to departures from normality. For skewed data, Levene’s test is safer.
The formula
F = s₁² ÷ s₂², df₁ = n₁ − 1, df₂ = n₂ − 1
s² = Σ(x − x̄)² ÷ (n − 1)
Under H₀ the ratio follows the F distribution with (df₁, df₂) degrees of freedom. For a two-tailed test, reject when F is below the lower critical value or above the upper one, each cutting off α/2.
The same F ratio appears in ANOVA and regression, built from sums of squares rather than two sample variances; the F-statistic calculator covers those cases.
A worked example
The default data: sample 1 is 22, 27, 28, 30, 31, 36 and sample 2 is 21, 24, 25, 26, 27. Do they come from populations with the same variance?
- Sample 1: mean 29, Σ(x − x̄)² = 108, so s₁² = 108 ÷ 5 = 21.6.
- Sample 2: mean 24.6, Σ(x − x̄)² = 21.2, so s₂² = 21.2 ÷ 4 = 5.3.
- F = 21.6 ÷ 5.3 = 4.0755 with 5 and 4 degrees of freedom.
- Two-tailed at α = 0.05: the critical values are 0.1354 and 9.3645. F lies between them, and p = 0.198.
- Decision: do not reject H₀. The first sample looks about twice as spread out (s₁/s₂ = 2.02), but with samples this small the difference could be chance.
Many textbook answers to this problem compare F = 4.07 with the 5% table value F(5, 4) = 6.26 and reach the same conclusion. That is the right-tailed test (select “σ₁² > σ₂²”), which gives p = 0.099.
Upper 5% points of F
| df₂ \ df₁ | 4 | 5 | 10 |
|---|---|---|---|
| 4 | 6.39 | 6.26 | 5.96 |
| 5 | 5.19 | 5.05 | 4.74 |
| 10 | 3.48 | 3.33 | 2.98 |
| 20 | 2.87 | 2.71 | 2.35 |
These are the right-tailed critical values at α = 0.05; the calculator computes any other combination exactly.
Common mistakes
- Dividing standard deviations. 4.65 ÷ 2.30 = 2.02 is the ratio of SDs; F is its square, 4.08.
- Using n instead of n − 1. Both the variances and the degrees of freedom use n − 1.
- Swapping the degrees of freedom. The numerator's df comes first. F(5, 4) at 5% is 6.26; F(4, 5) is 5.19.
- Ignoring normality. The test assumes both populations are normal; with skewed data its p-values can be badly wrong.
Common questions
What does the F-test for two variances test?
Whether two normal populations have the same variance. H₀: σ₁² = σ₂². The statistic is the ratio of the sample variances, F = s₁² ÷ s₂², which is close to 1 when H₀ is true. It is often run before a two-sample t-test to decide between the pooled (equal-variance) and Welch versions.
Should the larger variance go on top?
Many textbooks put the larger variance in the numerator so that F ≥ 1 and only the upper table is needed. That is fine, but then a two-tailed test at level α must be compared with the upper α/2 critical value. Comparing it with the α table (6.26 for df 5 and 4 at 5%) is in effect a test at 2α. This calculator keeps the samples in the order you enter them and gives both critical values for a two-tailed test, so the choice of numerator does not change the p-value.
What are the degrees of freedom?
n₁ − 1 for the numerator and n₂ − 1 for the denominator. The order matters: F(5, 4) and F(4, 5) are different distributions. The lower critical value of F(df₁, df₂) is the reciprocal of the upper critical value of F(df₂, df₁).
Is the F-test robust?
No. It is sensitive to non-normality: skewed or heavy-tailed data can produce a significant F even when the variances are equal. For data that may not be normal, Levene's test or the Brown–Forsythe test is safer. The F-test in ANOVA, which compares means, is a different and much more robust use of the same distribution.
Can I use standard deviations instead of variances?
Yes. Choose “Summary: s and n” and the calculator squares them. Always square before dividing: the F statistic is a ratio of variances, not of standard deviations.
Related calculators
-
Variance calculator
Sample and population variance with every step.
-
T-test calculator
Compare two means, with or without equal variances.
-
ANOVA calculator
The F distribution used to compare several means.
-
Z-test calculator
Tests for means and proportions with known σ.