t statistic calculator
Compute a t statistic from means, standard deviations and sample sizes. Pick one-sample, two-sample (Welch or pooled) or paired, and get t, its degrees of freedom, the p-value and the critical value.
t distribution with 24 df. The shaded tails beyond ±|t| are the p-value.
Show the working, step by step
Standard error of the mean.
SE = s ÷ √n = 6.1 ÷ √25 = 1.22
Divide the distance from the hypothesised value by the standard error.
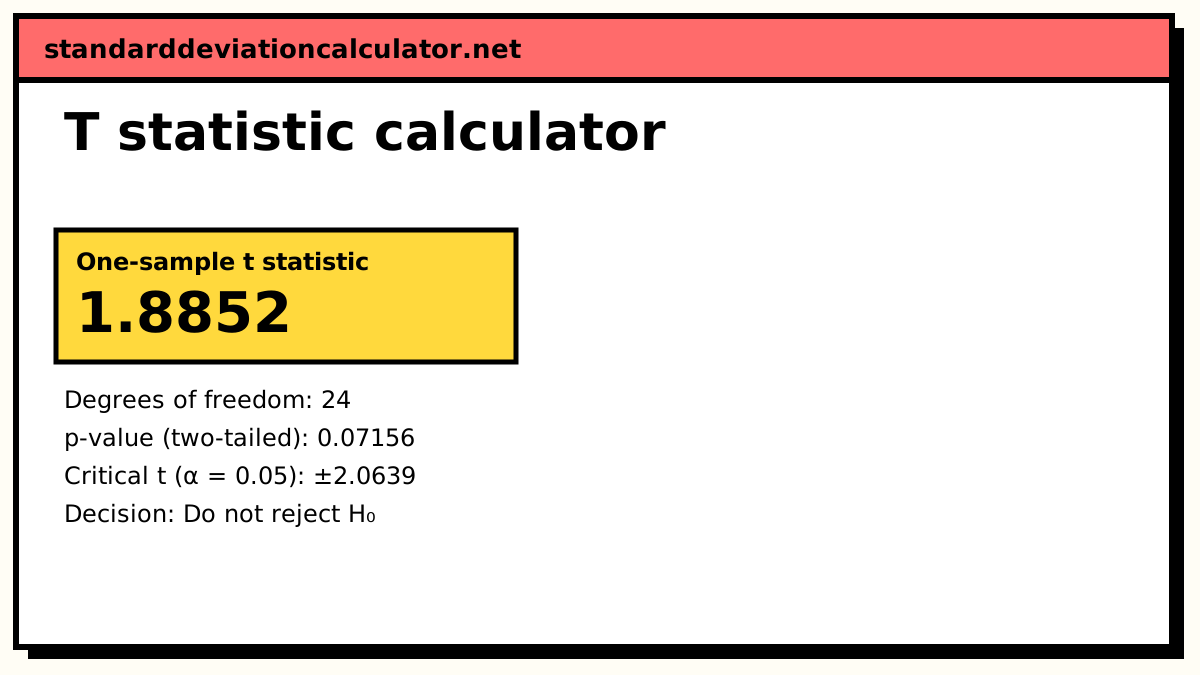
t = (x̄ − μ₀) ÷ SE = (52.3 − 50) ÷ 1.22 = 1.8852 df = n − 1 = 24
p-value (two-tailed) from the t distribution with 24 df.
p = 2 × P(T ≥ |1.885|) = 0.07156 critical t at α = 0.05: ±2.0639
p = 0.07156 is not below α = 0.05: the data are consistent with H₀.
The formulas
One-sample: t = (x̄ − μ₀) ÷ (s ÷ √n), df = n − 1 Welch: t = (x̄₁ − x̄₂) ÷ √(s₁²/n₁ + s₂²/n₂), df by Welch–Satterthwaite Pooled: t = (x̄₁ − x̄₂) ÷ (s_p √(1/n₁ + 1/n₂)), df = n₁ + n₂ − 2 Paired: t = d̄ ÷ (s_d ÷ √n), df = n − 1
Here s_p² = ((n₁ − 1)s₁² + (n₂ − 1)s₂²) ÷ (n₁ + n₂ − 2) is the pooled variance. If the null hypothesis names a non-zero difference, subtract it in the numerator.
A worked one-sample example
The default: a sample of n = 25 has mean x̄ = 52.3 and standard deviation s = 6.1. Is the population mean different from μ₀ = 50?
- Standard error: 6.1 ÷ √25 = 6.1 ÷ 5 = 1.22.
- t = (52.3 − 50) ÷ 1.22 = 1.885, with df = 24.
- Two-tailed p = 0.0716. The critical value at α = 0.05 is ±2.064.
Since |1.885| is less than 2.064, do not reject H₀ at the 5% level. If the alternative had been one-sided (μ > 50), p would halve to 0.0358 and the critical value would drop to 1.711. The result would then be significant, which is why the direction of the test must be chosen before looking at the data.
Two samples and paired data
For two independent groups with x̄₁ = 78.2, s₁ = 8.4, n₁ = 30 and x̄₂ = 73.5, s₂ = 10.1, n₂ = 28, Welch's standard error is √(2.352 + 3.643) = 2.449. That gives t = 4.7 ÷ 2.449 = 1.920 on 52.67 df and p = 0.0603. The pooled version gives s_p = 9.259, t = 1.932 on 56 df and p = 0.0584.
For paired data, enter the mean and SD of the differences. With d̄ = 2.4, s_d = 3.1 and 15 pairs, t = 2.4 ÷ (3.1 ÷ √15) = 2.998 on 14 df and p = 0.0096, a significant change.
How to interpret t
The sign of t shows the direction: positive when the first mean is larger. Its size is the difference measured in standard errors, so it grows with the sample size even when the difference stays the same. That is why a tiny effect can be significant in a big sample. Report the difference itself (or an effect size such as Cohen's d) alongside t and p. The chart shades the area beyond the observed t. That area is the p-value.
Common mistakes
- Using the SD where the standard error belongs. Divide s by √n first.
- Pooling very unequal variances. If one SD is more than about twice the other, use Welch.
- Treating paired data as independent. Use the differences and the paired test.
- Choosing one-tailed after seeing the data. It halves p, and choosing it after the fact is a form of p-hacking.
Common questions
What does the t statistic measure?
How many standard errors the observed mean (or difference in means) lies from the value the null hypothesis claims. t = 1.89 means the sample mean is 1.89 standard errors above μ₀. The t distribution then says how often a gap that large would turn up by chance.
Should I use Welch or pooled for two samples?
Welch's version is the safer default. It does not assume the two populations have the same variance and loses very little when they do. The pooled version is slightly more powerful when the variances really are equal and the sample sizes are similar. In the default data the two give t = 1.920 (df 52.7) and t = 1.932 (df 56), with the same conclusion.
Why is the Welch df not a whole number?
The Welch–Satterthwaite formula approximates the distribution of the statistic with a t distribution whose df is chosen to match its variance. That df can be any positive number between min(n₁, n₂) − 1 and n₁ + n₂ − 2. Software uses it unrounded; with printed tables, round down.
When is a paired t-test right?
When each observation in one group is matched with one in the other: the same people before and after, twins, left and right eyes. Work on the differences. The test is a one-sample t on those differences with df = pairs − 1. Treating paired data as two independent samples throws away the pairing and usually loses a lot of power.
What is the difference between a t statistic and a z statistic?
A z statistic divides by a standard error built from a known population σ. A t statistic uses the sample SD, which adds uncertainty, so its distribution has heavier tails. As n grows the two converge. At df = 24 the two-tailed 5% critical value is 2.064 for t and 1.960 for z.
Related calculators
-
T-test calculator
Run the full t-test from raw data, with a confidence interval.
-
P-value calculator
Turn any z, t, chi-square or F statistic into a p-value.
-
Degrees of freedom calculator
Welch–Satterthwaite and the df for other common tests.