F statistic calculator
Work out an F statistic and its p-value. Start from an ANOVA table, from a regression's R², or from two sample variances. The calculator gives the degrees of freedom, the critical value and the decision.
Have standard deviations? Square them first.
F(2, 27) density. The shaded tail to the right of the observed F is the p-value; the 3.354 critical value cuts off 5%.
| Source | SS | df | MS | F |
|---|---|---|---|---|
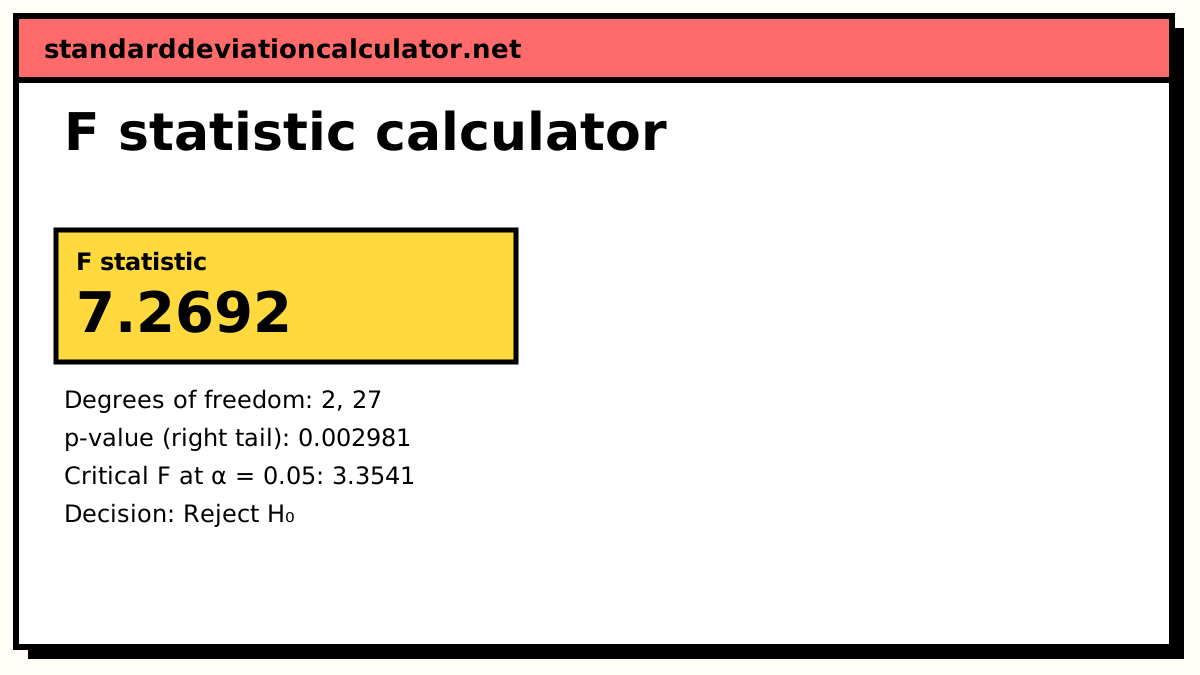
| Between groups | 84 | 2 | 42 | 7.2692 |
| Within groups | 156 | 27 | 5.77778 | |
| Total | 240 | 29 |
Show the working, step by step
Degrees of freedom.
df between = k − 1 = 3 − 1 = 2 df within = N − k = 30 − 3 = 27
Mean squares: each sum of squares over its df.
MSB = 84 ÷ 2 = 42 MSW = 156 ÷ 27 = 5.77778
F is the ratio of the mean squares.
F = MSB ÷ MSW = 42 ÷ 5.77778 = 7.2692
Upper-tail p-value from the F(2, 27) distribution, and the critical value at α = 0.05.
p = P(F ≥ 7.2692) = 0.002981 F critical = 3.3541 7.269 > 3.354: reject H₀.
F tests are right-tailed: a large F means the numerator variance is big relative to the denominator. The test assumes normal errors and, for ANOVA, equal group variances.
The formulas
ANOVA: F = (SSB ÷ (k − 1)) ÷ (SSW ÷ (N − k)) Regression: F = (R² ÷ k) ÷ ((1 − R²) ÷ (n − k − 1)) Variances: F = s₁² ÷ s₂², df = (n₁ − 1, n₂ − 1)
Every version is a mean square divided by a mean square. The p-value is the area of the F distribution to the right of the observed F.
A worked example from an ANOVA table
The default compares k = 3 groups with N = 30 observations in all. The between-groups sum of squares is SSB = 84 and the within-groups sum of squares is SSW = 156.
- Degrees of freedom: between = 3 − 1 = 2, within = 30 − 3 = 27.
- Mean squares: MSB = 84 ÷ 2 = 42 and MSW = 156 ÷ 27 = 5.778.
- F = 42 ÷ 5.778 = 7.269.
- From the F(2, 27) distribution, p = 0.00298. The critical value at α = 0.05 is 3.354.
Because 7.269 is larger than 3.354 (and p is below 0.05), reject the hypothesis that the three group means are equal. The effect size η² = 84 ÷ 240 = 0.35: group membership accounts for 35% of the total variation.
From a regression
Switch the mode to regression to test whether any of k predictors matters. With R² = 0.62 from k = 3 predictors and n = 40 observations, F = (0.62 ÷ 3) ÷ (0.38 ÷ 36) = 19.58 on (3, 36) df. The p-value is below 0.0001 against a critical value of 2.866.
From two variances
The third mode divides one sample variance by another. With s₁² = 24.5 (n₁ = 11) and s₂² = 10.2 (n₂ = 13), F = 2.402 on (10, 12) df. The right-tail p is 0.0764 and the critical F is 2.753, so the first variance is not significantly larger at the 5% level. The two-sided p for "the variances differ" is 0.153.
How to interpret F
F near 1 is what chance alone produces. How far above 1 counts as significant depends heavily on the degrees of freedom. With few denominator df the critical value is large, so a small study needs a big F. A significant ANOVA F tells you that at least one group mean differs, not which one. Follow it with a post-hoc comparison such as Tukey's HSD. A significant regression F tells you that the predictors together explain more than nothing, but not which predictor does.
Common mistakes
- Swapping the degrees of freedom. The numerator df comes first, and the order changes the critical value.
- Dividing sums of squares instead of mean squares. SSB ÷ SSW is not F. Divide each by its df first.
- Using standard deviations as variances. Square s before forming a variance ratio.
- Doubling a regression p-value. ANOVA and regression F tests are one-tailed by design.
Common questions
What is an F statistic?
A ratio of two variance estimates, each divided by its degrees of freedom. Under the null hypothesis both estimate the same variance, so F should be near 1. A large F means the numerator (between-groups variation, or variation explained by a regression) is bigger than chance alone would produce.
Why is the p-value right-tailed?
In ANOVA and regression only a large F counts against H₀. A small F just means the groups differ less than expected by chance. When you compare two variances with a two-sided alternative, double the smaller tail. The variance-ratio mode shows that two-tailed p as well.
How do I get F from R²?
F = (R² ÷ k) ÷ ((1 − R²) ÷ (n − k − 1)), with k predictors and n observations. With R² = 0.62, k = 3 and n = 40, F = 0.2067 ÷ 0.01056 = 19.58 on (3, 36) degrees of freedom. The critical value at α = 0.05 is 2.866, so the regression is significant.
Which degrees of freedom go first?
The numerator's. For ANOVA that is k − 1 (between groups) then N − k (within). For regression it is k then n − k − 1. For two variances it is n₁ − 1 then n₂ − 1. Swapping them changes the critical value: F(0.05; 2, 27) = 3.354 but F(0.05; 27, 2) = 19.46.
How is this different from the F-test calculator?
The F-test calculator runs the full test that two population variances are equal, from raw data or summary statistics. This page computes the F statistic itself from three different starting points (ANOVA sums of squares, regression R², or two variances) and gives its p-value and critical value.
Related calculators
-
ANOVA calculator
One-way ANOVA from raw group data, with the full table.
-
F-test calculator
Test two variances for equality from data or s and n.
-
Degrees of freedom calculator
The df for t-tests, chi-square, ANOVA and regression.