McNemar's test calculator
Test whether a yes/no proportion changed when the same people were measured twice. Enter the four cells of the paired table; the calculator gives McNemar's χ² with and without the continuity correction, the exact binomial p-value and the odds ratio.
If nothing changed, each of the 35 discordant pairs is a coin flip, so b follows these bars. Solid bars: the two-sided 5% rejection region of the exact test. The observed b is inside it. The χ² statistic is a large-sample approximation to this same distribution.
| After: yes | After: no | Total | |
|---|---|---|---|
| Before: yes | 45 | 25 | 70 |
| Before: no | 10 | 20 | 30 |
| Total | 55 | 45 | 100 |
Show the working, step by step
Only the discordant pairs carry information: b changed yes → no, c changed no → yes.
b = 25, c = 10, b + c = 35
McNemar’s χ² (1 degree of freedom).
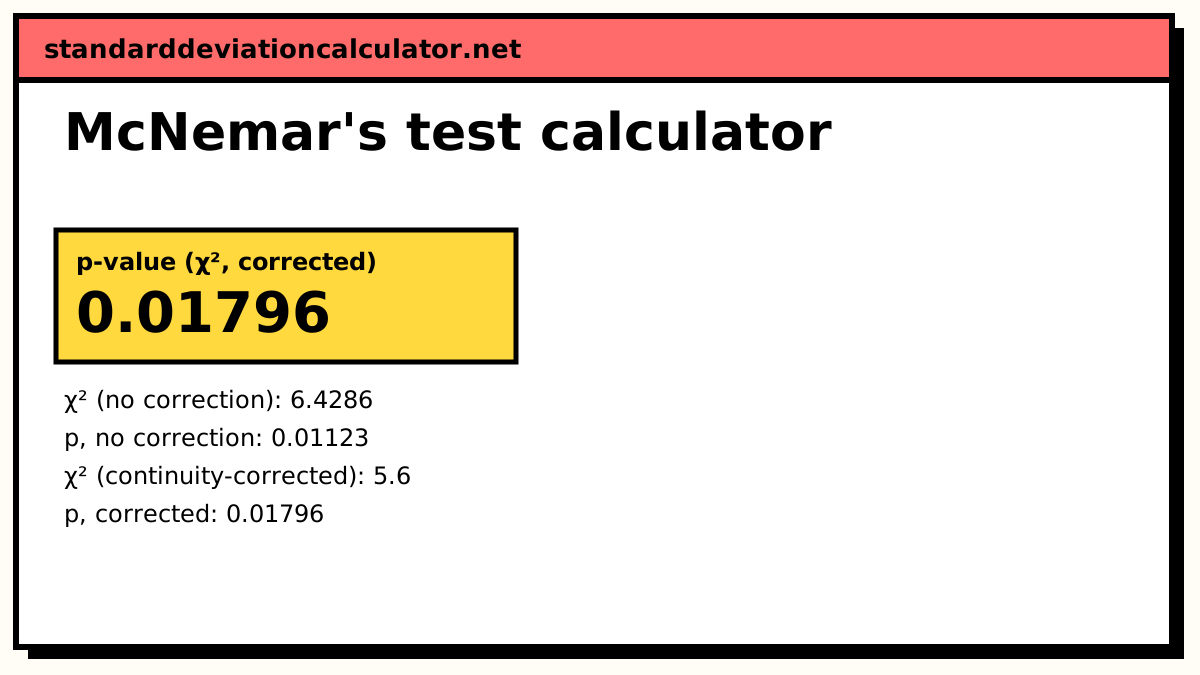
χ² = (b − c)² ÷ (b + c) = (25 − 10)² ÷ 35 = 6.4286, p = 0.01123
With Edwards’ continuity correction (what R’s mcnemar.test reports by default).
χ² = (|b − c| − 1)² ÷ (b + c) = (15 − 1)² ÷ 35 = 5.6, p = 0.01796
Exact test: under H₀ each discordant pair is equally likely to go either way, so b ~ Binomial(b + c, ½).
p = 2 × P(X ≤ 10) = 0.01667
Odds ratio for paired data and its 95% interval.
OR = b ÷ c = 25 ÷ 10 = 2.5 ln OR ± 1.96 × √(1/b + 1/c) → 1.201 to 5.205
The concordant cells a = 45 and d = 20 do not enter the test at all. They affect the proportions but not the evidence that the proportions changed.
The formulas
χ² = (b − c)² ÷ (b + c) χ²_corrected = (|b − c| − 1)² ÷ (b + c) exact p = 2 × P(X ≤ min(b, c)), X ~ Binomial(b + c, ½)
Both χ² statistics have 1 degree of freedom. Under H₀ each discordant pair is equally likely to have switched either way, which is where the Binomial(b + c, ½) comes from.
How to set up the table
Each subject goes in exactly one cell, according to both answers. Rows are the first measurement, columns the second. The cells are a (yes, yes), b (yes, then no), c (no, then yes) and d (no, no). The total is the number of subjects, not the number of answers.
Worked example
100 people are asked whether they support a local policy, then asked again after a public debate. 45 said yes both times, 25 switched from yes to no, 10 switched from no to yes, and 20 said no both times.
| After: yes | After: no | Total | |
|---|---|---|---|
| Before: yes | 45 | 25 | 70 |
| Before: no | 10 | 20 | 30 |
| Total | 55 | 45 | 100 |
Support fell from 70% to 55%. Only the 35 people who changed their answer matter for the test.
- Uncorrected: χ² = (25 − 10)² ÷ 35 = 6.43, p = 0.0112.
- Continuity-corrected: χ² = (15 − 1)² ÷ 35 = 5.60, p = 0.0180.
- Exact: p = 2 × P(X ≤ 10) for X ~ Binomial(35, ½) = 0.0167.
All three are below 0.05, so the drop in support after the debate is statistically significant. The odds ratio b/c = 2.5 says that among people who changed their mind, switching against the policy was two and a half times as common as switching towards it.
Interpreting the result
McNemar's test tells you the marginal proportions differ, here 70% against 55%. The size of the change is the difference in those proportions, (b − c) ÷ n = 15 ÷ 100 = 15 percentage points. The test says nothing about why people changed; in a before-and-after design without a control group, other events between the two surveys could explain the shift.
The three p-values will always be close when there are plenty of discordant pairs. When they disagree about significance, trust the exact binomial value: it makes no approximation, and the corrected χ² is known to be conservative while the uncorrected χ² can be slightly liberal.
Common mistakes
- Entering the before and after totals (70 and 55 yes) as if they were two independent groups. The pairing is the whole point.
- Running the test with very few discordant pairs and relying on χ². Use the exact p-value when b + c is under about 25.
- Putting the same person in two cells. Every subject contributes one count.
- Concluding nothing changed because a and d are large. Concordant pairs do not dilute the test.
Common questions
When do I use McNemar's test?
When the same subjects give a yes/no answer twice, or when subjects are matched in pairs. Typical cases: opinion before and after a campaign, two diagnostic tests applied to the same patients, or matched case-control studies. The question is whether the proportion saying yes changed.
Why does McNemar’s test ignore the a and d cells?
Pairs that gave the same answer twice say nothing about whether the answer tends to change. All the evidence about a shift is in the discordant pairs: b who switched one way and c who switched the other. If there were no real change, b and c would be about equal.
Which p-value should I report: corrected, uncorrected or exact?
With fewer than about 25 discordant pairs, report the exact binomial p-value. With more, the continuity-corrected χ² is the traditional choice and is what R's mcnemar.test prints. The uncorrected χ² is closer to the exact p-value on average but slightly liberal. In the default example the three give 0.0112, 0.0180 and 0.0167.
Can I use a chi-square test of independence on paired data instead?
No. The independence test assumes every observation is a different subject. With paired data the two measurements on the same person are correlated, and the test answers a different question: whether the first answer predicts the second, not whether the overall rate changed.
What is the odds ratio in McNemar’s test?
b ÷ c, the conditional odds ratio for matched pairs. In the example 25 people switched from yes to no and 10 from no to yes, so OR = 2.5: switching away was 2.5 times as common as switching towards. Its 95% interval, 1.20 to 5.21, excludes 1, in line with the significant test.
Related calculators
-
Fisher's exact test
Exact 2×2 test for two independent groups.
-
Chi-square calculator
Goodness of fit and independence for unpaired counts.
-
t-test calculator
Paired t-test for before-and-after measurements on a numeric scale.